
Over the past 24 to 48 hours, gold prices (XAUUSD) have shown significant volatility, closing yesterday at $4212.3, marking a notable rebound from the prior day’s low. This fluctuation was primarily driven by two major factors: on one hand, the ongoing truce between Iran and Israel in the Middle East has provided temporary stability and relief to the market; on the other hand, the latest hot U.S. Consumer Price Index (CPI) data reinforced expectations of further Federal Reserve interest rate hikes, boosting the U.S. dollar and pressuring gold prices.
This market dynamic highlights the dual role of gold as a safe haven asset: geopolitical tension easing allows a short-lived rally, yet persistent inflation and tight monetary policy limit upside potential. For the average investor, this means the gold market remains highly uncertain in the near term, influenced heavily by upcoming economic data releases and geopolitical developments, warranting close attention.
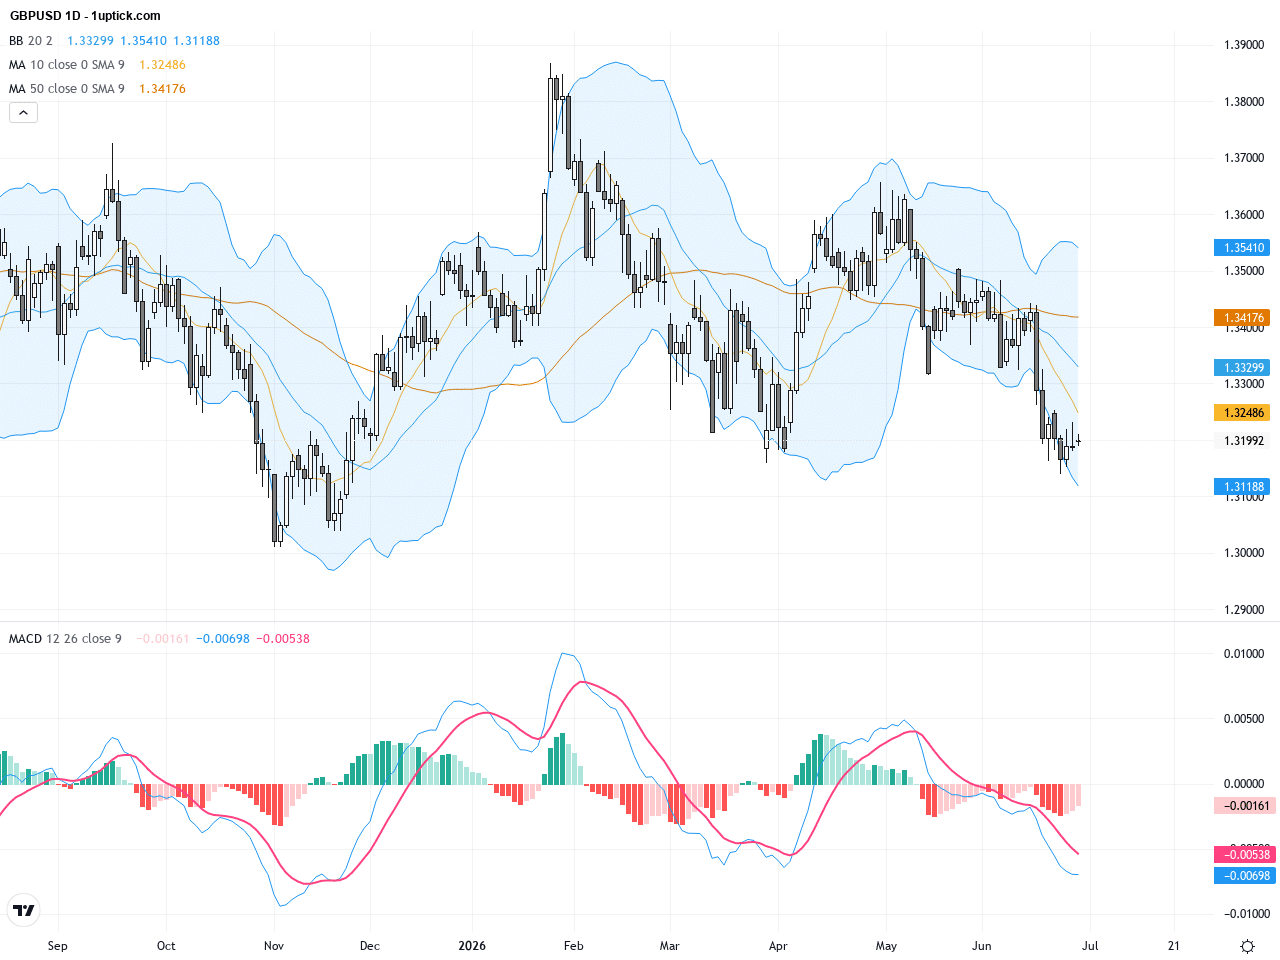
The daily chart illustrates a clear downtrend from mid-May levels above 4500. Short-term moving averages have crossed below medium and long-term ones, signaling stronger selling pressure. Bollinger Bands have tightened, suggesting a potential breakout point approaching as volatility decreases. The MACD is below zero with shrinking bearish momentum, indicating the selling pressure may be easing but no clear reversal is confirmed. Overall, the trend remains bearish with caution for potential further downside testing of support zones.
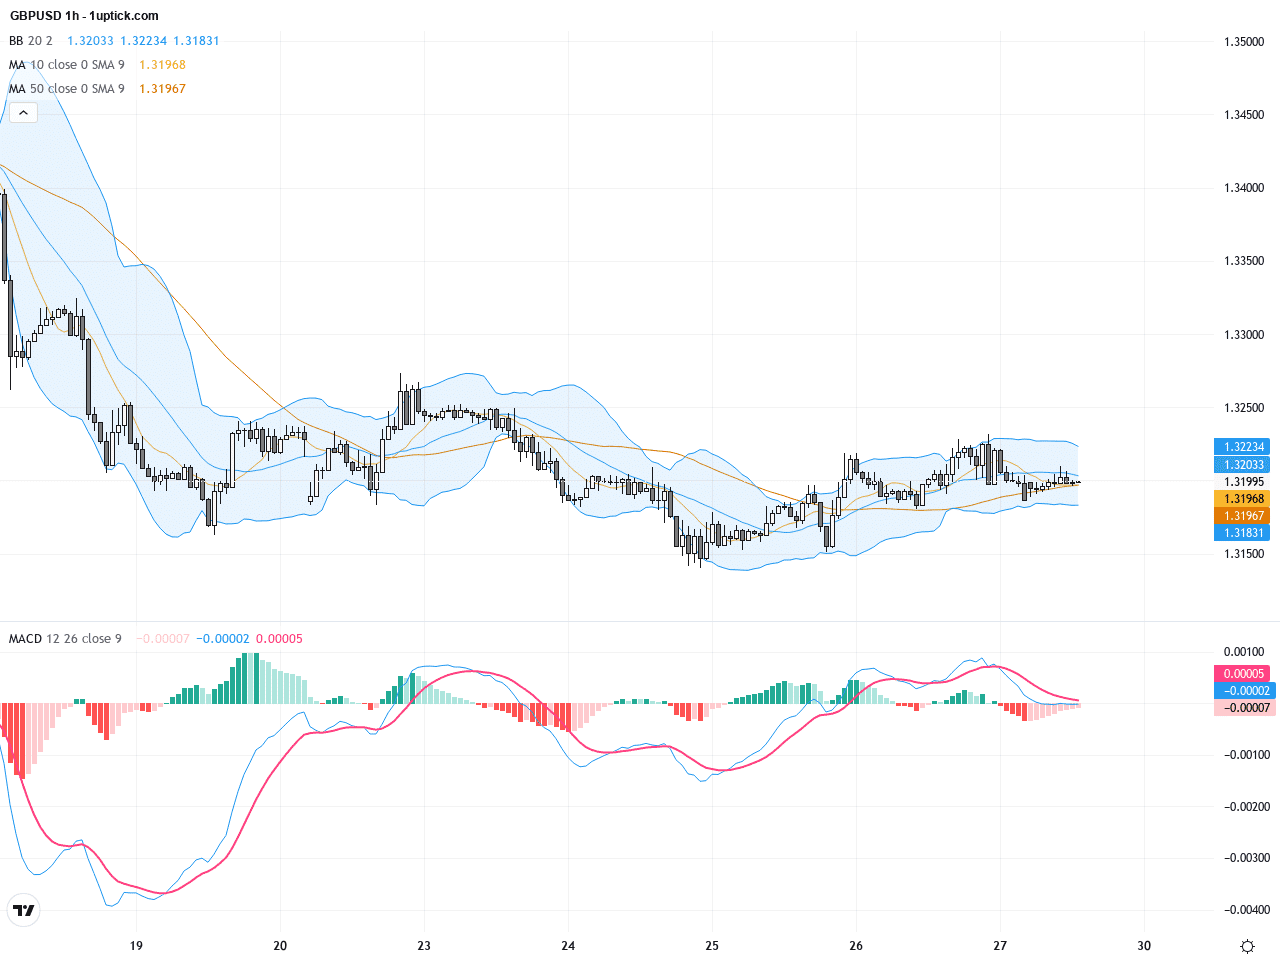
The hourly chart shows consolidation between 4200 and 4300 over the last 3 to 5 days. Bollinger Bands slightly widen accompanied by a mild MACD bullish crossover, which hints at a possible short-term bounce. RSI levels remain neutral, implying limited buying strength at this stage. A small flag pattern is forming, with a break above 4300 potentially triggering a short-term rally.
Technical Trend: Cautiously Bearish Consolidation
Technically, XAUUSD remains in a downtrend on the daily timeframe, with narrowing Bollinger Bands signaling a potential breakout soon. On the hourly chart, a flag consolidation pattern suggests possible short-term directional movement. A recent hammer candlestick with a long lower wick suggests buying interest near support levels, hinting at a potential short-term rebound. Combined with MACD momentum shifts, the market is in a state of indecision, making volume and momentum shifts vital for identifying upcoming trade opportunities.Today features key economic releases in Europe and the US. Particularly significant is the US Producer Price Index at 14:30 GMT+1, a vital inflation gauge. A stronger-than-expected reading may reinforce market expectations for continued Fed tightening, likely weighing on XAUUSD. The ECB press conference at 14:45 GMT+1 also demands attention, as it could influence risk sentiment and the Dollar index, indirectly impacting gold prices. Traders should watch these events closely for any surprises that could alter the current price trajectory.
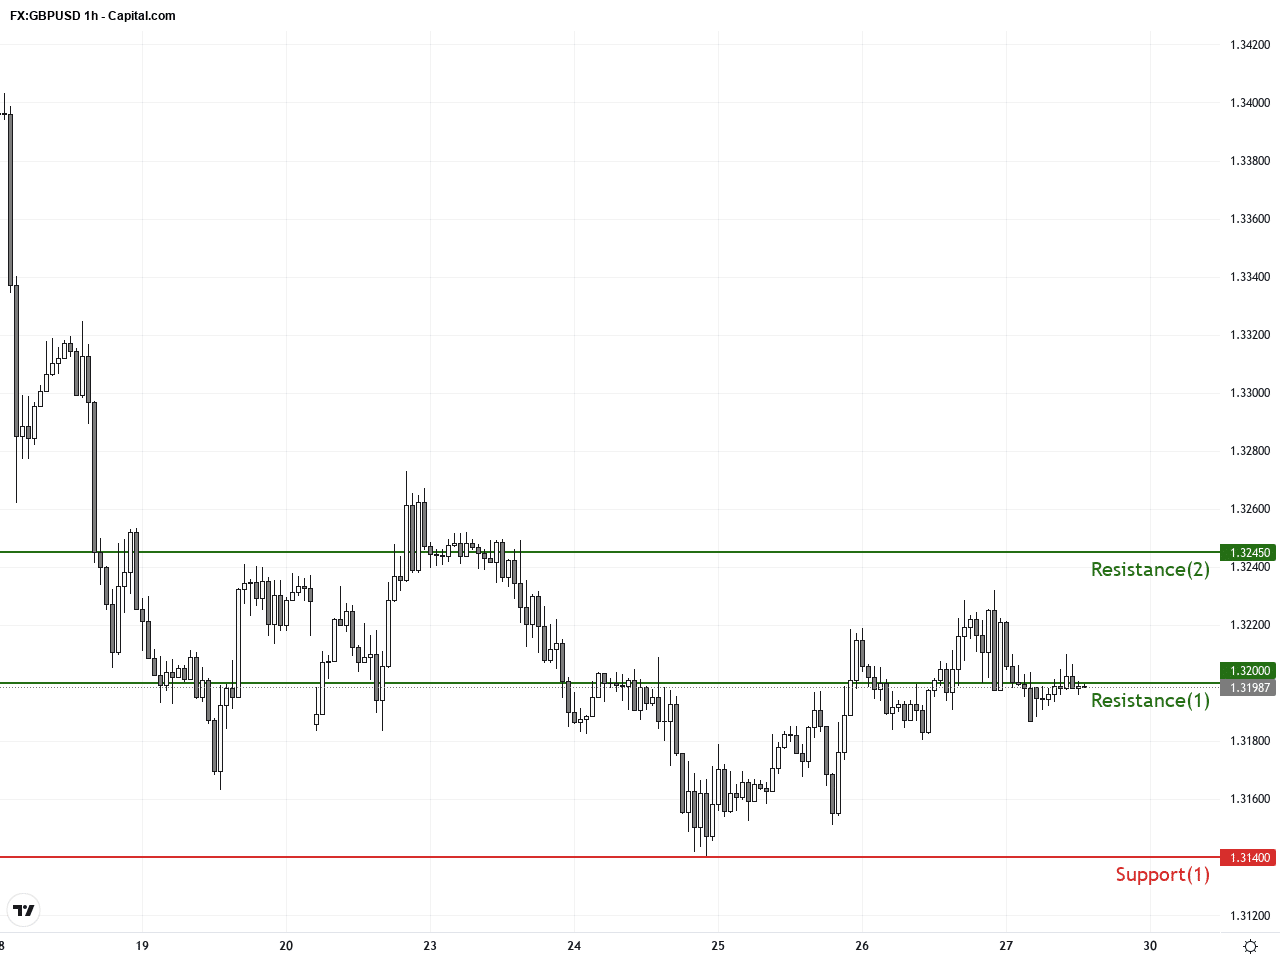
Resistance & Support
The above financial market data, quotes, charts, statistics, exchange rates, news, research, analysis, buy or sell ratings, financial education, and other information are for reference only. Before making any trades based on this information, you should consult independent professional advice to verify pricing data or obtain more detailed market information. 1uptick.com should not be regarded as soliciting any subscriber or visitor to execute any trade. You are solely responsible for all of your own trading decisions.