
Over the past 48 hours, gold (XAUUSD) has experienced notable market activity, rebounding around 2.5% from the June 18th closing price of $4210. Investors focused on easing tensions in the Middle East and fresh reassessments of the Federal Reserve’s monetary policy helped push prices higher.
Recently, the global asset trading atmosphere has been vibrant, with Bybit announcing a Global Assets Trading Fest across TradFi and crypto markets offering a $202,000 USDT prize pool, injecting enthusiasm into the market. Meanwhile, the cancellation of planned US military strikes on Iran by President Trump eased geopolitical fears, reducing safe-haven pressures and supporting gold’s price rebound.
Additionally, multiple central banks are expected to increase gold purchases over the next 12 months, underscoring solid fundamental demand. The dollar held steady while oil prices declined, easing inflation concerns and tempering expectations for aggressive Fed rate hikes, which further buoyed gold as a hedge against inflation and financial risks.
In simple terms, the recent gold price action reflects investor behavior seeking safety amid global uncertainty. The stabilized Middle East situation and a softer US dollar created favorable conditions for buyers to step into bullion. For everyday investors, these price movements illustrate how geopolitical and macroeconomic shifts directly influence asset valuations.
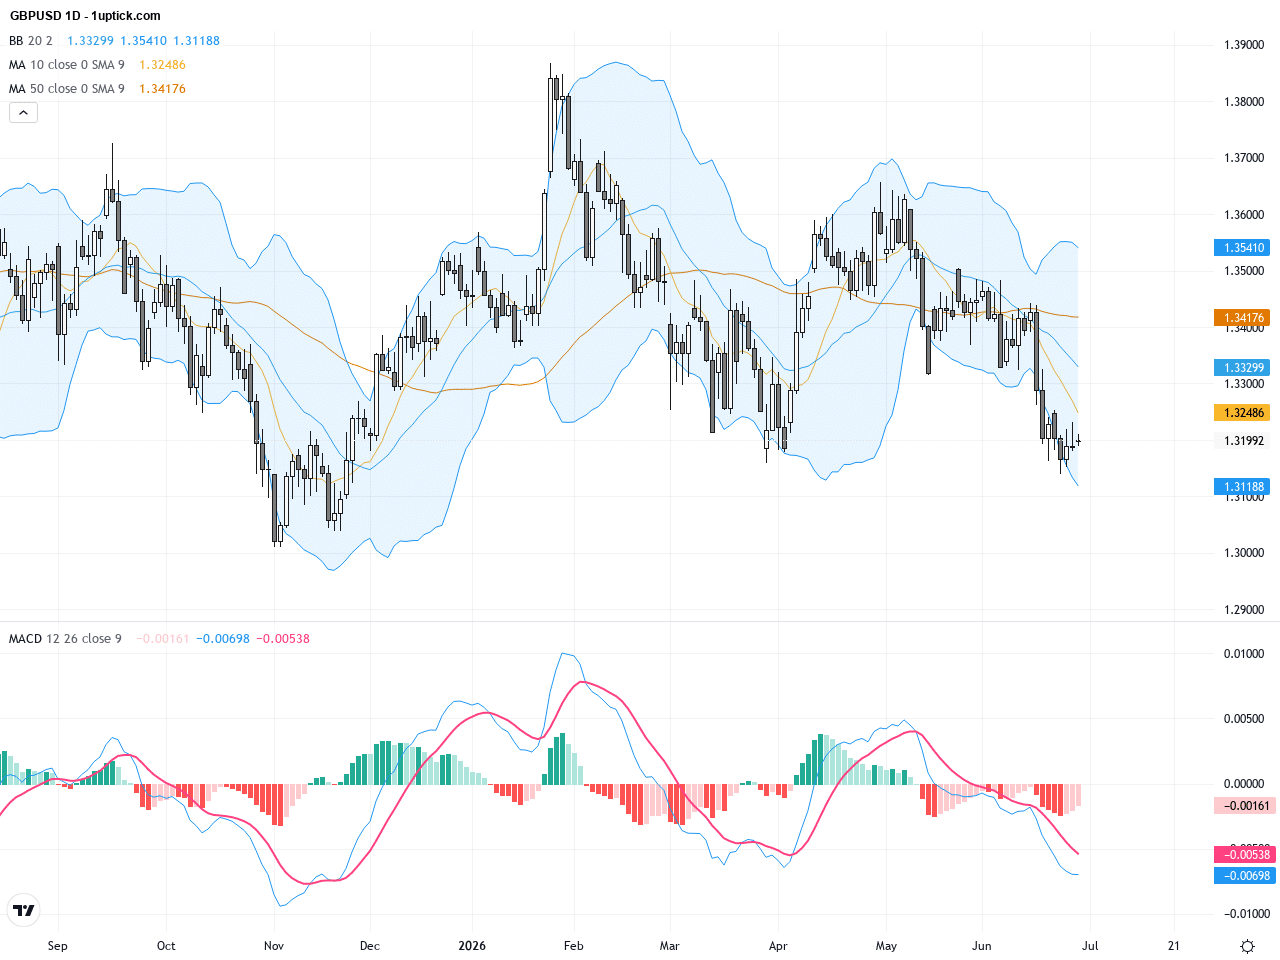
The daily chart reveals XAUUSD retreating from recent highs with a clear downward trend as it tests the crucial support around 4210. The price has repeatedly tested the 4200-4250 support zone, indicating a strong defense level. Bollinger Bands, which began to widen, suggest potential for increased volatility. Short-term moving averages are positioned below longer-term ones, pointing to a bearish bias on a medium-term scale. The MACD remains negative but shows signs of narrowing momentum, hinting at a possible slowdown in bearish pressure. Overall, the daily trend suggests consolidation and testing of support, signaling caution for traders.
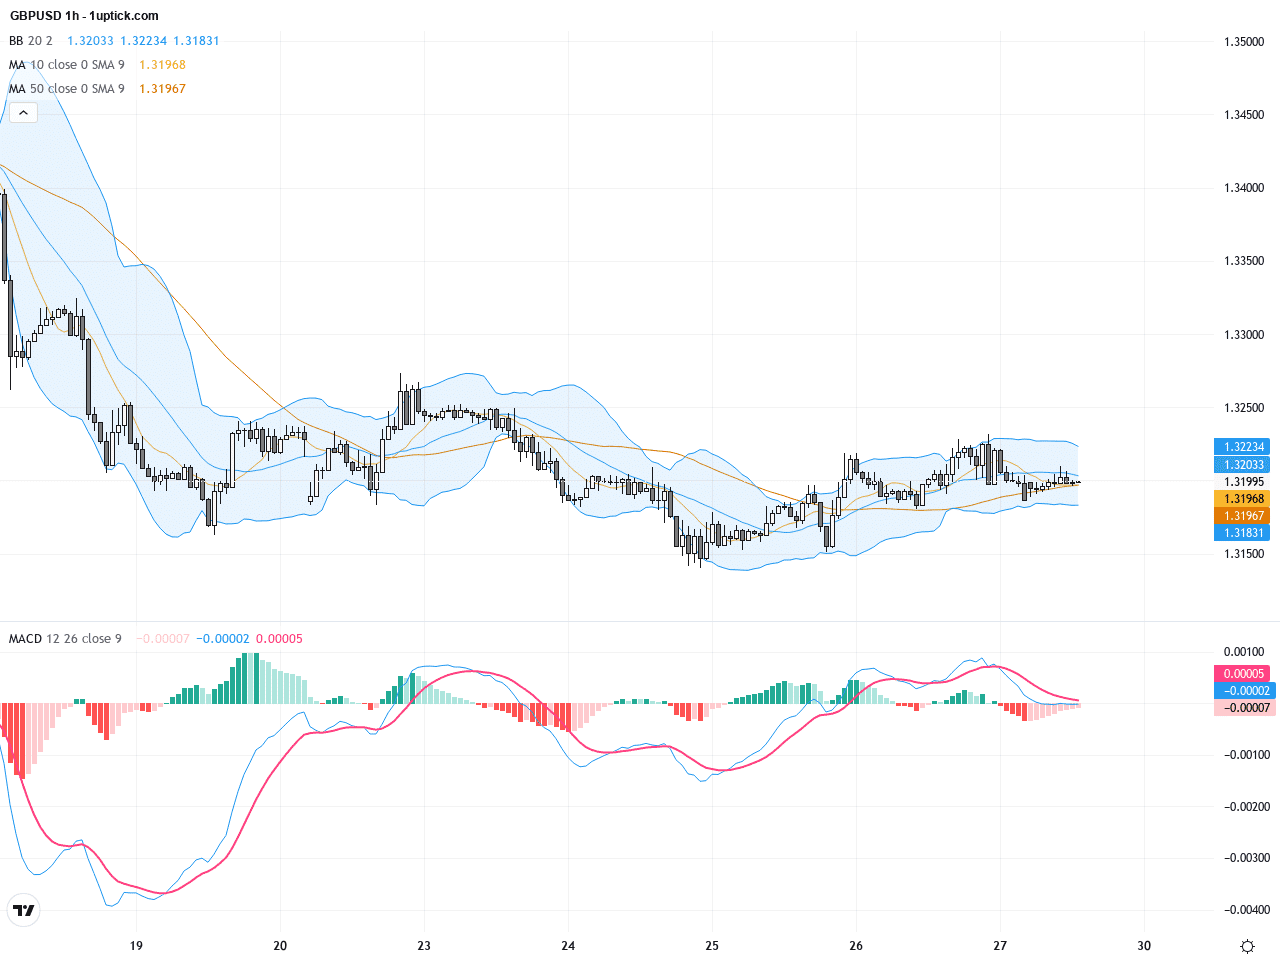
In the past five days, the hourly chart shows a gradual pullback with price consolidating near 4210, with narrowing volatility around the Bollinger midline. Short-term moving averages have crossed, reflecting a mild retracement phase. Recent candlesticks have shown hammer-like long lower shadows, evidencing buying interest at support levels. The MACD histogram has shifted from negative to positive, suggesting a potential short-term momentum rebound. The hourly chart presents a balanced battle between buyers and sellers, and a break either below or above 4210 will likely dictate the near-term direction.
Technical Trend: The current XAUUSD trend is best described as choppy consolidation, with heightened short-term volatility and a cautiously bearish outlook but possibilities of a near-term rebound.
Technically, XAUUSD is at a critical support zone with potential to form a short-term base if 4210 holds. Daily moving averages and MACD suggest the overall trend remains bearish but with diminishing downside momentum. Hourly data points to short-term rebound potential. Key candlestick patterns including recent hammer formations and upper wicks show intense tug-of-war between bulls and bears, indicating volatility ahead. Traders should watch closely for volume confirmation and decisive breaks of technical levels to seize high-probability trade setups.Today’s global economic calendar features key US data including the Philadelphia Fed Index and weekly Jobless Claims, both scheduled at 14:30 GMT+1. Stronger-than-expected readings could boost the USD and pressure gold prices downward. Other data such as UK employment figures and EU current account updates are unlikely to cause significant direct impact on XAUUSD. Overall, no major economic event today is expected to drastically move gold, but traders will monitor Fed-related signals closely for directional cues.
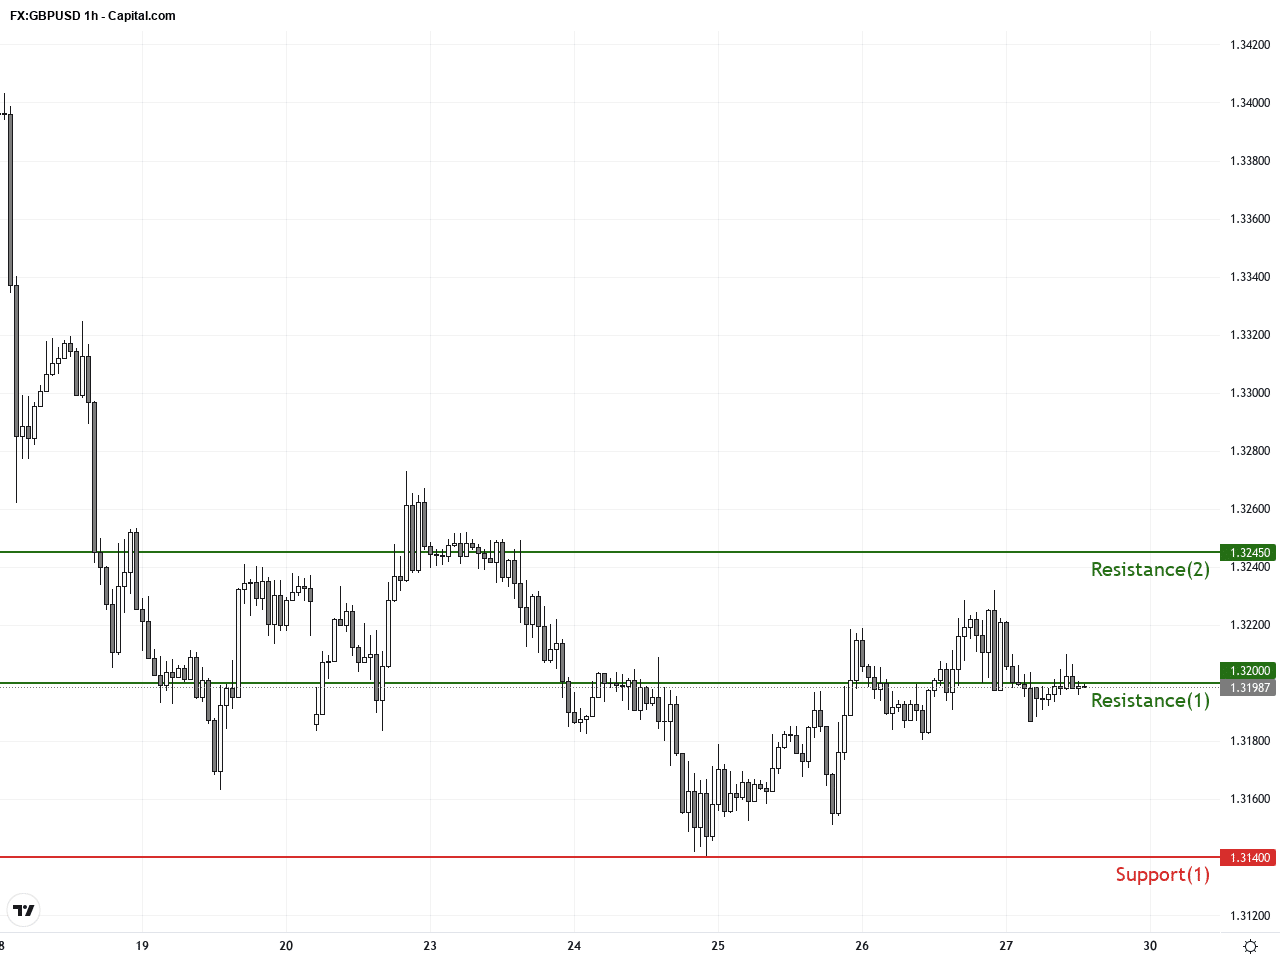
Resistance & Support
The above financial market data, quotes, charts, statistics, exchange rates, news, research, analysis, buy or sell ratings, financial education, and other information are for reference only. Before making any trades based on this information, you should consult independent professional advice to verify pricing data or obtain more detailed market information. 1uptick.com should not be regarded as soliciting any subscriber or visitor to execute any trade. You are solely responsible for all of your own trading decisions.