Over the past 24 to 48 hours, the gold (XAUUSD) market has shown marked volatility. Relative to the closing price of 4618.885 USD on April 30, 2026, gold prices have fluctuated intensely over several days, pressured by the Federal Reserve’s stance to maintain higher interest rates and a strengthening U.S. dollar. Recent market news indicates the Fed signaling a “higher-for-longer” rate approach, pushing yields up to 4.402%, which bolstered the dollar and diminished hopes of a sustained gold breakout.
At the same time, a pullback in the dollar spurred a rebound in gold prices the following day, underscoring the short-term inverse relationship between the dollar and gold. The retreat of oil prices also provided temporary relief from downward pressure on gold. However, overall, ongoing geopolitical uncertainties and inflation concerns continue to pose multifaceted risks to the gold market. For the average investor, the recent moves reflect how volatile safe-haven assets become amid global economic instability, highlighting the need for cautious investment strategies amid rapidly shifting monetary policies and international developments.

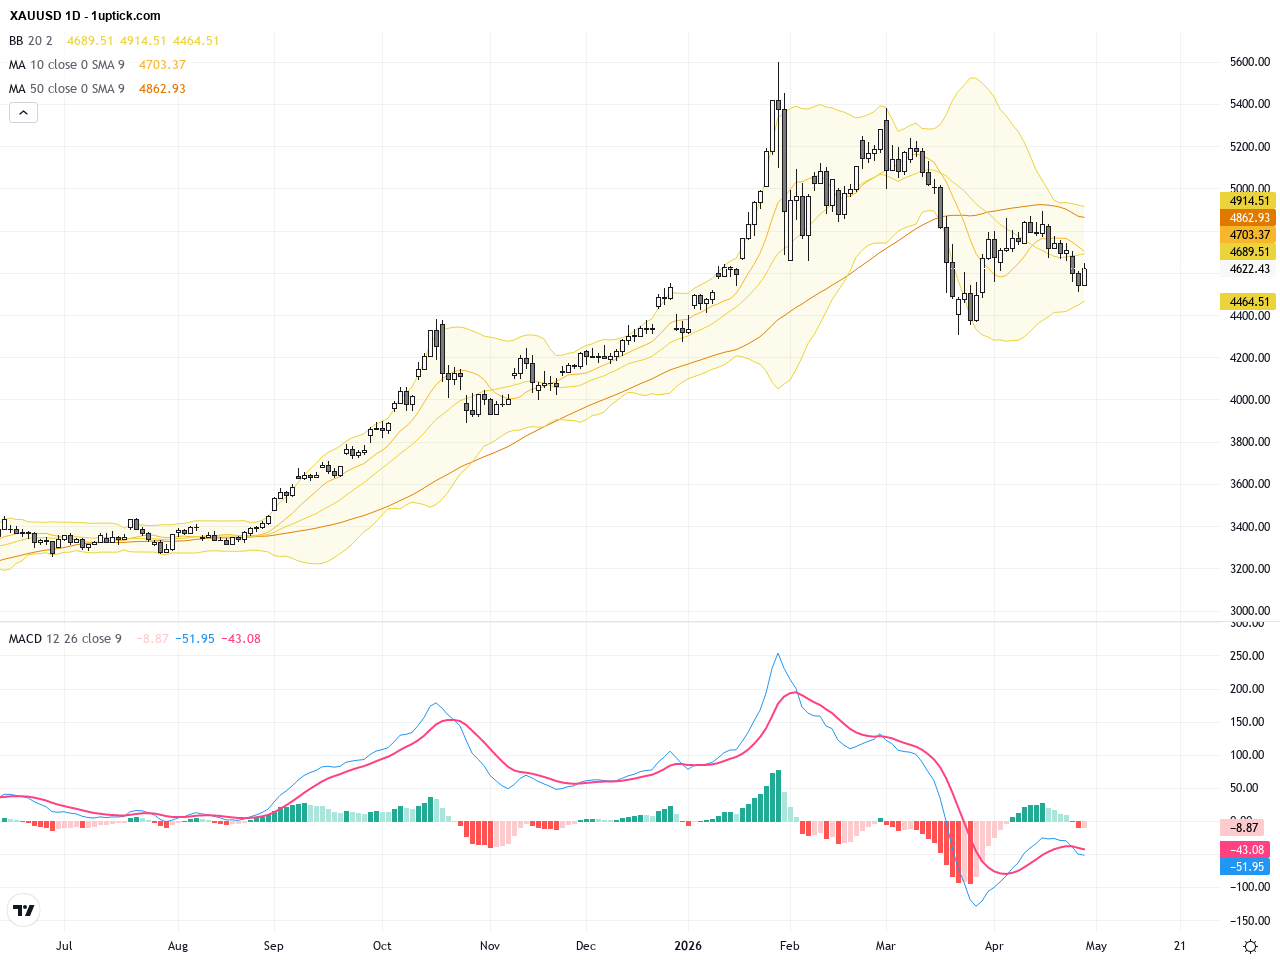
The daily chart depicts a clear downward trend for XAUUSD in recent sessions, with prices dropping from around 4700 towards the 4600 level. The 20-day and 50-day moving averages have formed a bearish crossover, with Bollinger Bands widening to signal increased volatility. The MACD remains below zero with diverging fast and slow lines, reinforcing the bearish momentum on the daily timeframe. Overall, the medium-term trend leans bearish, indicating further downside risk for traders to monitor.

On the hourly chart, the past 3-5 days show a localized corrective rebound around the 4600 level, which however lacks strong momentum. The 20- and 50-hour moving averages remain in bearish alignment, and the Bollinger Bands midline applies downward pressure. The MACD oscillates near the zero line, reflecting short-term indecision. A symmetrical triangle consolidation pattern is forming, suggesting an imminent breakout which traders should watch closely for direction confirmation.
Technical Trend: XAUUSD currently shows a predominantly bearish and volatile sideways trend, with markets awaiting clear directional cues in the short term.
Technically, the widening Bollinger Bands and MACD bearish divergence on the daily chart highlight weakening momentum. The recent bearish engulfing candle pattern signals potential acceleration of the downtrend within the next 24 hours. The crucial support at 4600 must hold to sustain any rebound attempt; breakdown below this level could trigger a rapid sell-off. Traders should watch for breakout direction from the hourly triangle pattern to identify next high-probability moves.Today’s key economic events relevant to XAUUSD center around the US data releases at 14:30 GMT+1, including Personal Consumption Expenditures (PCE) and preliminary Q1 GDP figures. PCE inflation data is especially critical as it strongly influences US monetary expectations and thus the USD strength. A stronger-than-expected print could bolster the dollar and weigh on gold, whereas weaker data might support a near-term gold rally. There are no significant Japanese or Chinese releases today impacting XAUUSD, making the US afternoon events the primary market movers.
Resistance & Support

The above financial market data, quotes, charts, statistics, exchange rates, news, research, analysis, buy or sell ratings, financial education, and other information are for reference only. Before making any trades based on this information, you should consult independent professional advice to verify pricing data or obtain more detailed market information. 1uptick.com should not be regarded as soliciting any subscriber or visitor to execute any trade. You are solely responsible for all of your own trading decisions.