Over the past 24 to 48 hours, the British Pound against the US Dollar (GBP/USD) has exhibited noticeable weakness, fluctuating slightly below yesterday’s closing price of 1.34158 within a range of approximately 1.33997 to 1.34261. This movement was primarily driven by a stronger US Dollar Index following a robust May Producer Price Index (PPI) increase of 1.1%, boosting demand for the US dollar and putting downward pressure on GBP/USD.
Moreover, escalating tensions in the Middle East have heightened risk aversion, further strengthening the US dollar as a safe-haven currency and weighing on the British Pound. Although the Bank of England is expected to raise interest rates by 25 basis points later this year to address inflation, this prospective move has yet to offset the immediate selling pressure caused by geopolitical risks and strong US inflation data.
For the average investor, the recent GBP/USD volatility can be seen as a reflection of the combined impact of strong US economic data and global geopolitical uncertainties fueling dollar demand, which in turn pressures the Pound. Active traders should focus closely on upcoming US economic releases and developments in the Middle East as these factors will likely dictate near-term price action.
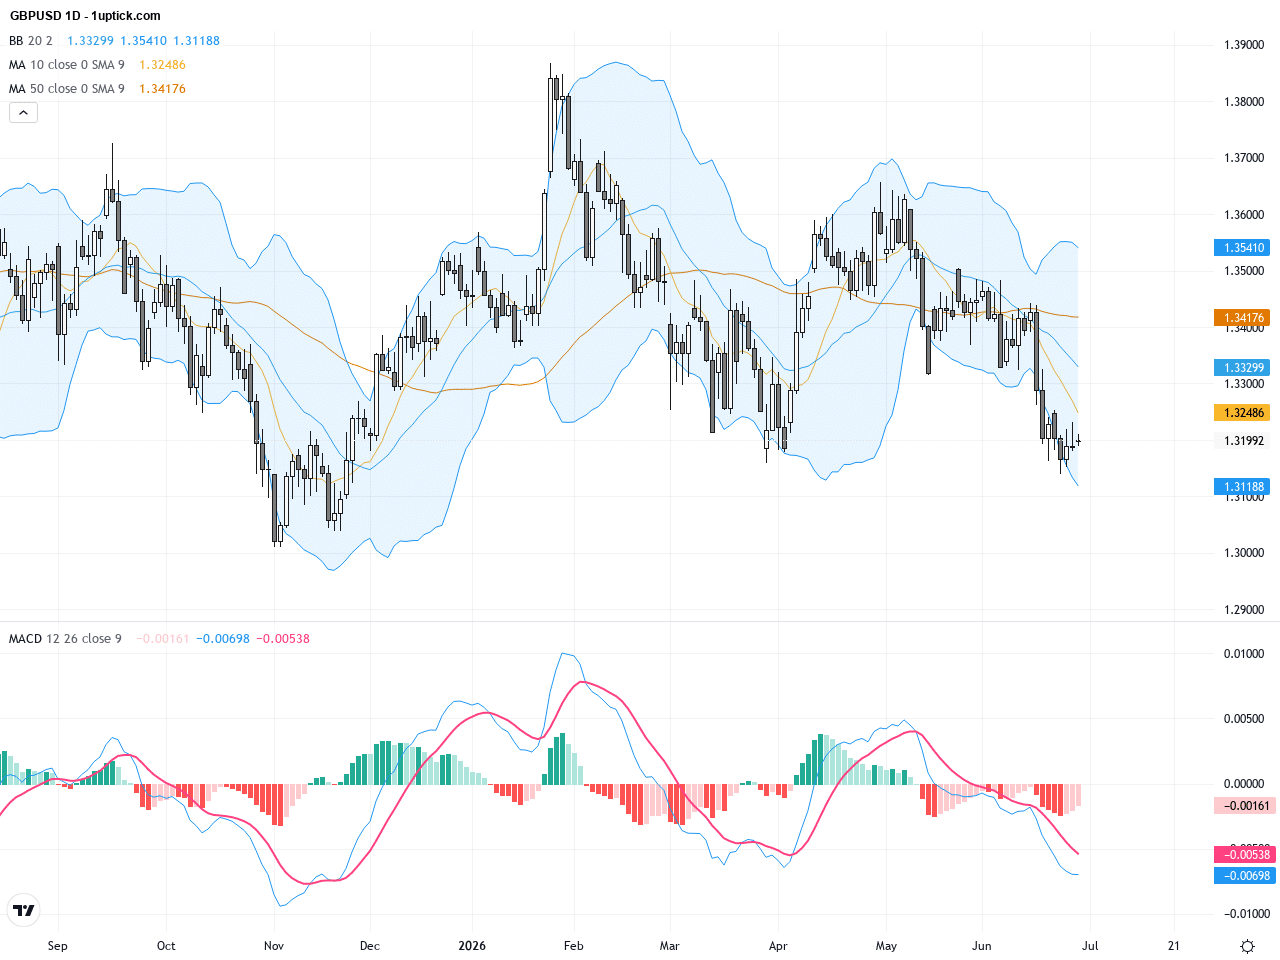
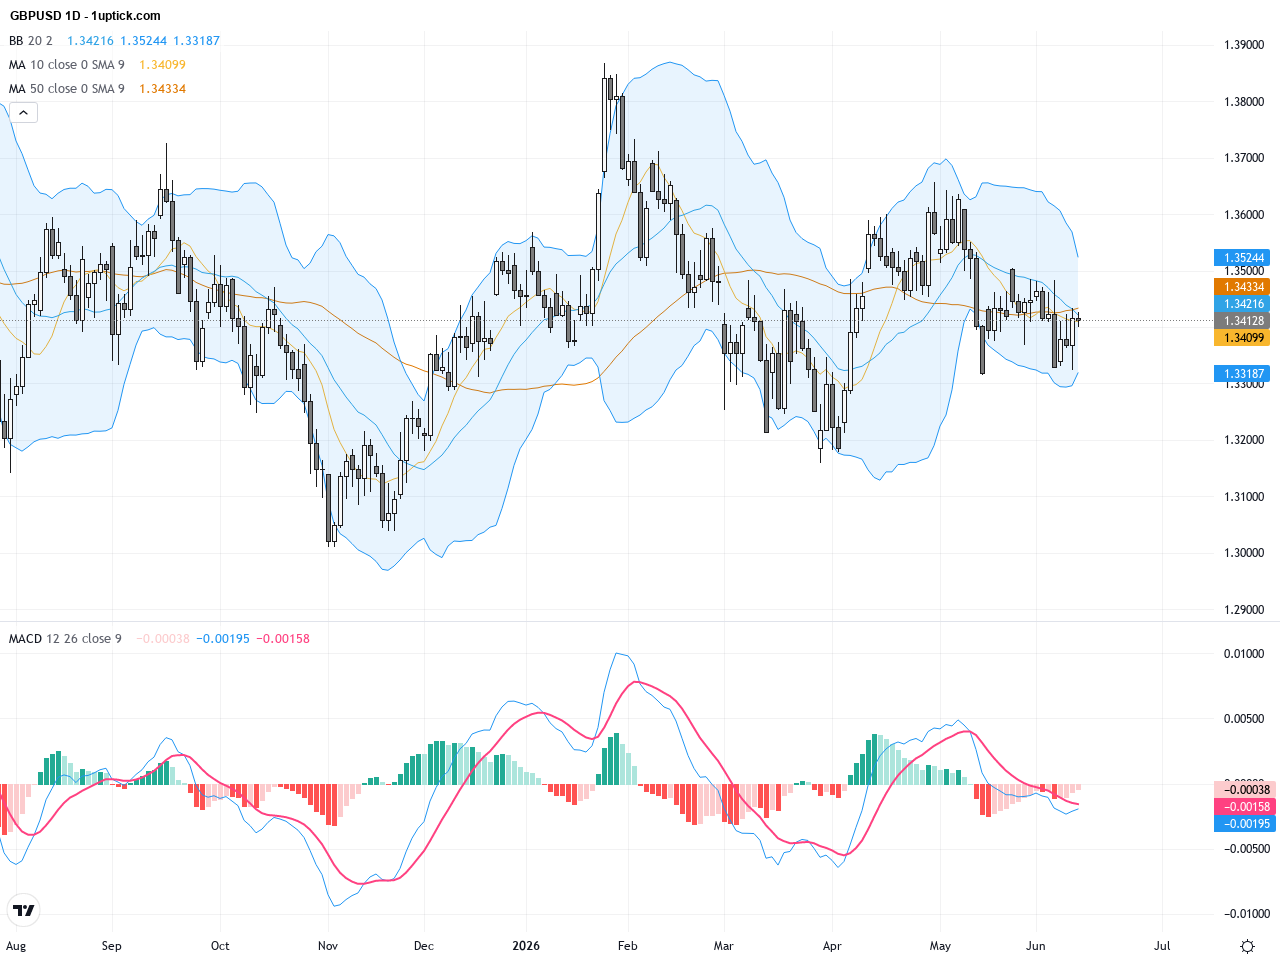
The daily chart shows a clear downtrend for GBPUSD, with prices declining from around 1.36 and forming a well-defined head and shoulders pattern. This pattern began to take shape near late May, with the neckline resting around 1.3410. The 50-day moving average stands near 1.3475, and the 200-day near 1.3405; recent price action broke below the 200-day MA, confirming bearish momentum. Bollinger Bands have widened with price gravitating toward the lower band, indicating increasing volatility. The MACD remains negative with widening divergence, signaling strong selling pressure.
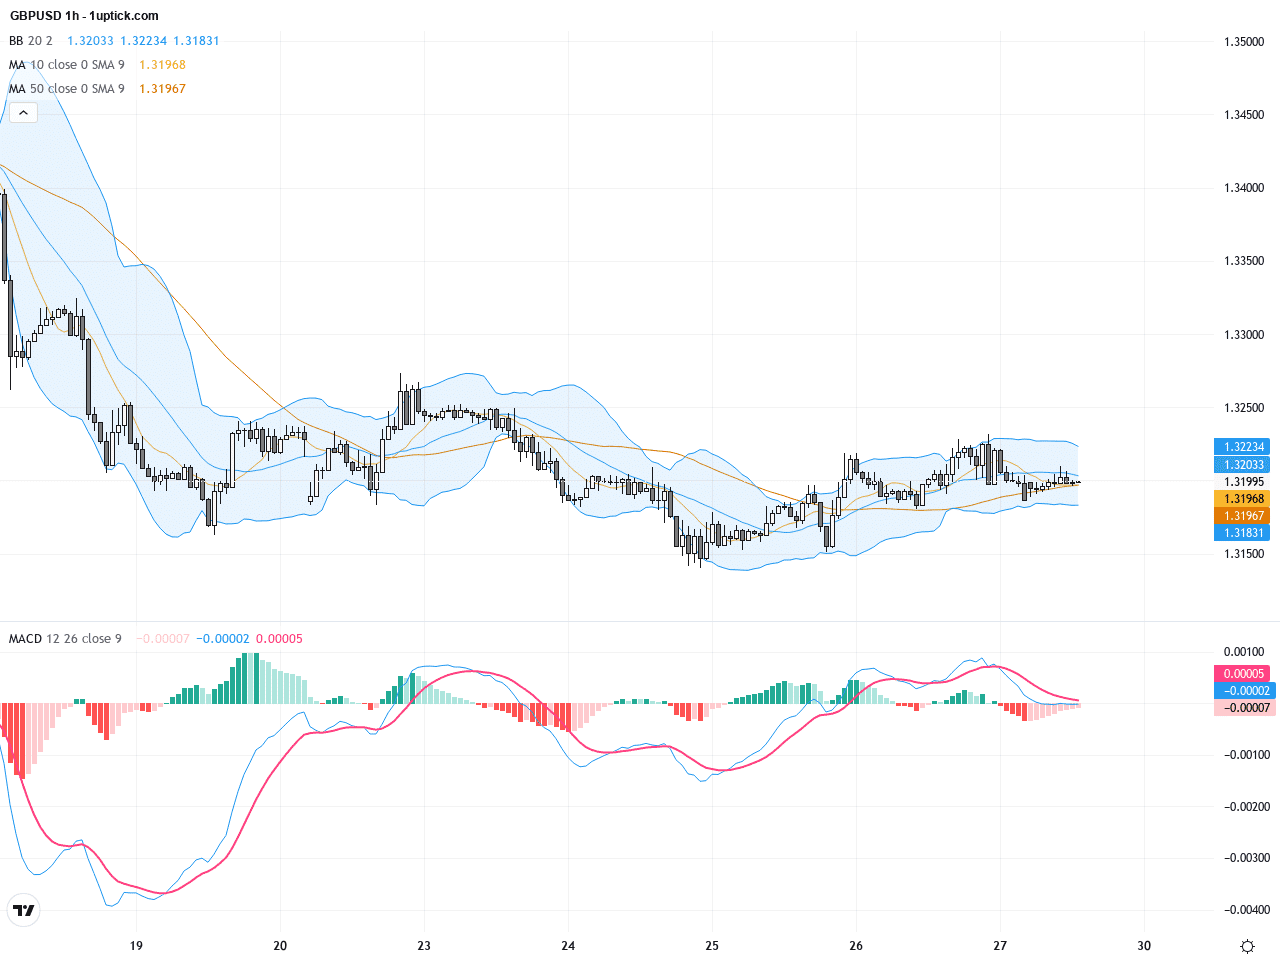
On the 1-hour chart covering the last 3-5 days, GBPUSD has continued weakening with short-term MAs (like the 10 and 20 periods) forming a bearish crossover. Price attempts to break above the neckline at 1.3410 have failed, confirming strong resistance at this level. Bollinger Bands are contracting, reflecting heightened short-term volatility. The MACD histogram shows some signs of fading bearish momentum but remains below zero, indicating no reversal yet. The latest engulfing bearish candlestick further supports a downside bias over the next 24 hours.
Technical Trend: GBPUSD is currently in a cautiously bearish phase, with both technical and fundamental drivers pushing downward amid consolidative volatility.
Technically, the GBPUSD head and shoulders pattern is a dominant bearish signal. A confirmed break below the neckline at 1.3410 could accelerate the downtrend. Daily MACD and moving average death crosses reinforce the bearish case. The short-term 1-hour engulfing bearish candle indicates continued downside pressure. Combining these with the fundamental backdrop — strong US dollar driven by inflation and geopolitical risks dampening the pound — the pair faces multiple headwinds. The alignment of technical and fundamental factors suggests further downside with caution warranted on potential pullbacks.According to today’s GMT+1 economic calendar, the UK will release important data at 08:00 including April’s GDP, trade balance, and industrial production, which carry direct relevance to GBPUSD. Positive surprises could provide some short-term support for sterling. Other key data from China and Japan are scheduled later but will have indirect effects. Overall, these UK reports will be crucial for gauging economic health and market sentiment, warranting close attention from traders.
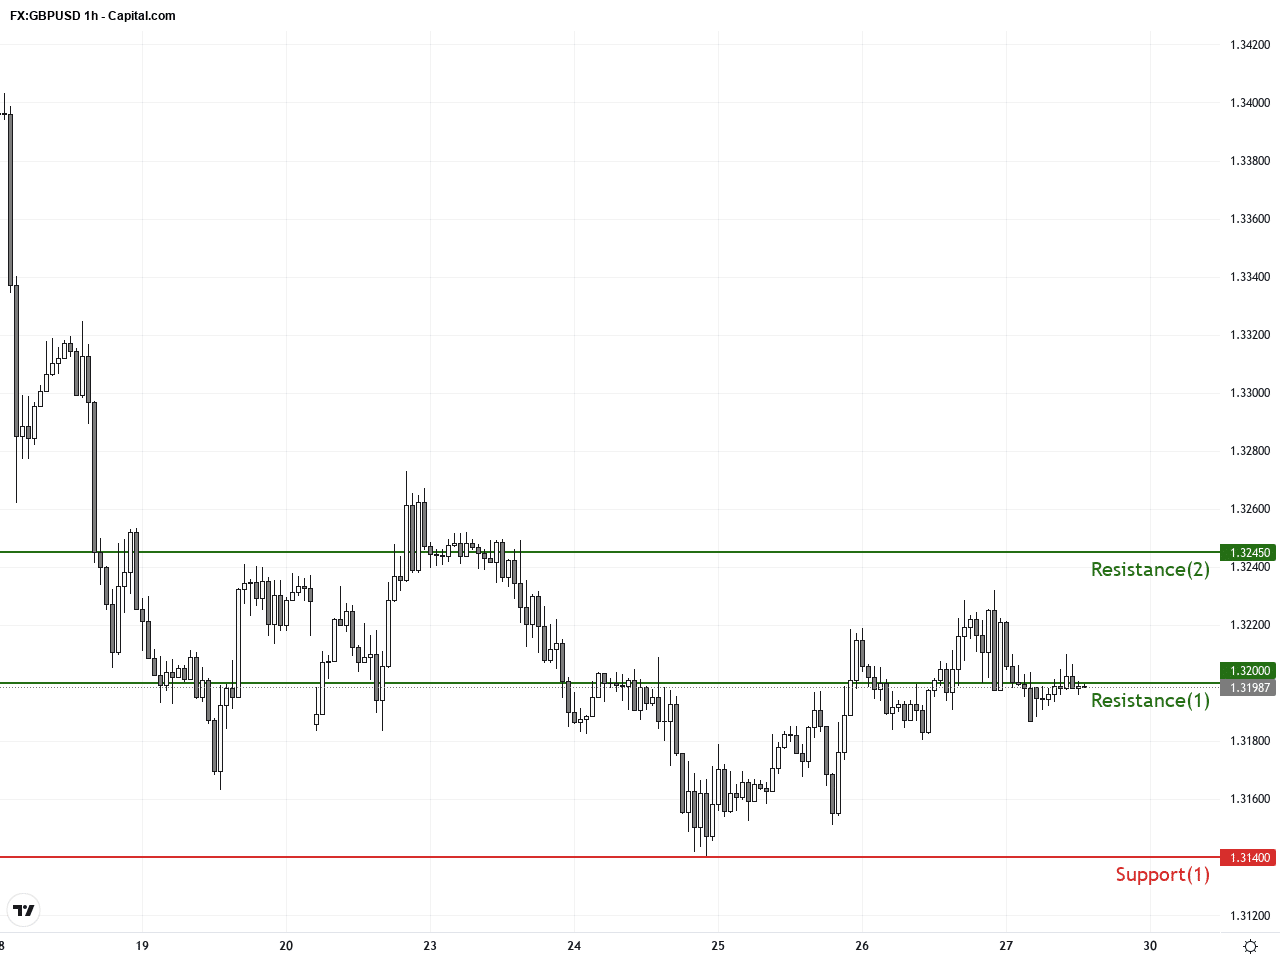
Resistance & Support
The above financial market data, quotes, charts, statistics, exchange rates, news, research, analysis, buy or sell ratings, financial education, and other information are for reference only. Before making any trades based on this information, you should consult independent professional advice to verify pricing data or obtain more detailed market information. 1uptick.com should not be regarded as soliciting any subscriber or visitor to execute any trade. You are solely responsible for all of your own trading decisions.