
Over the past 24 to 48 hours, the GBP/USD pair demonstrated relatively stable movement, hovering and slightly rising around yesterday’s closing price of 1.34308, currently near 1.3430. This performance was primarily driven by growing optimism surrounding a potential US-Iran peace deal, which boosted the pound above the 1.3400 level early in Asian trading. While geopolitical risks remain, market participants have somewhat relaxed their risk aversion due to hopeful signs of easing Middle East tensions.
The market narrative this week has been centered around the prospects of US-Iran diplomacy and its direct effects on forex market dynamics, especially GBP/USD. Continued progress towards peace could stabilize energy prices and geopolitical uncertainty, thereby supporting risk-sensitive currencies like the British pound. Meanwhile, UK’s modest 0.1% GDP contraction in April, mainly due to slowing service sector growth, had limited impact as investors remain focused more on international developments and expectations for Bank of England’s upcoming rate hikes.
To put it simply for the average investor, it’s akin to spotting a glimmer of peace amidst uncertainty, lifting confidence and pushing the pound slightly higher. Going forward, it will be crucial to watch whether Middle East tensions continue to ease alongside forthcoming US labor market reports and Bank of England policy signals, as these will drive GBP/USD short-term volatility.
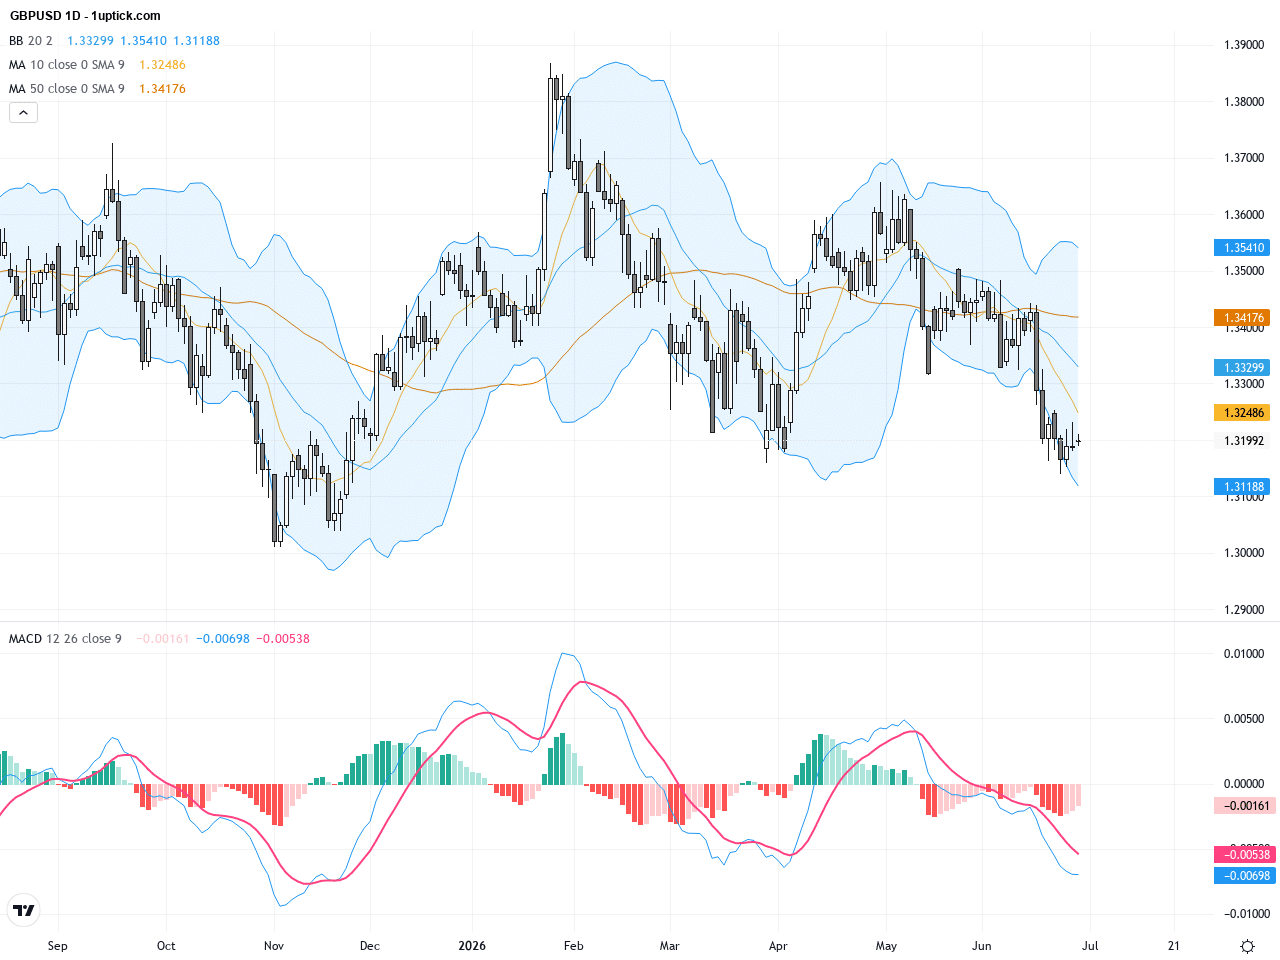
The daily chart reveals GBPUSD in a corrective downtrend since peaking at 1.3589, consolidating tightly between 1.34 and 1.35. The 200-day moving average near 1.3406 provides firm support, while the 50-day MA overhead at 1.3468 acts as resistance, indicating a tug of war in the medium term. Bollinger Bands have flattened, indicating reduced volatility, and the MACD at a low but converging position suggests a build-up towards a potential breakout if prices can surpass the 50-day MA.
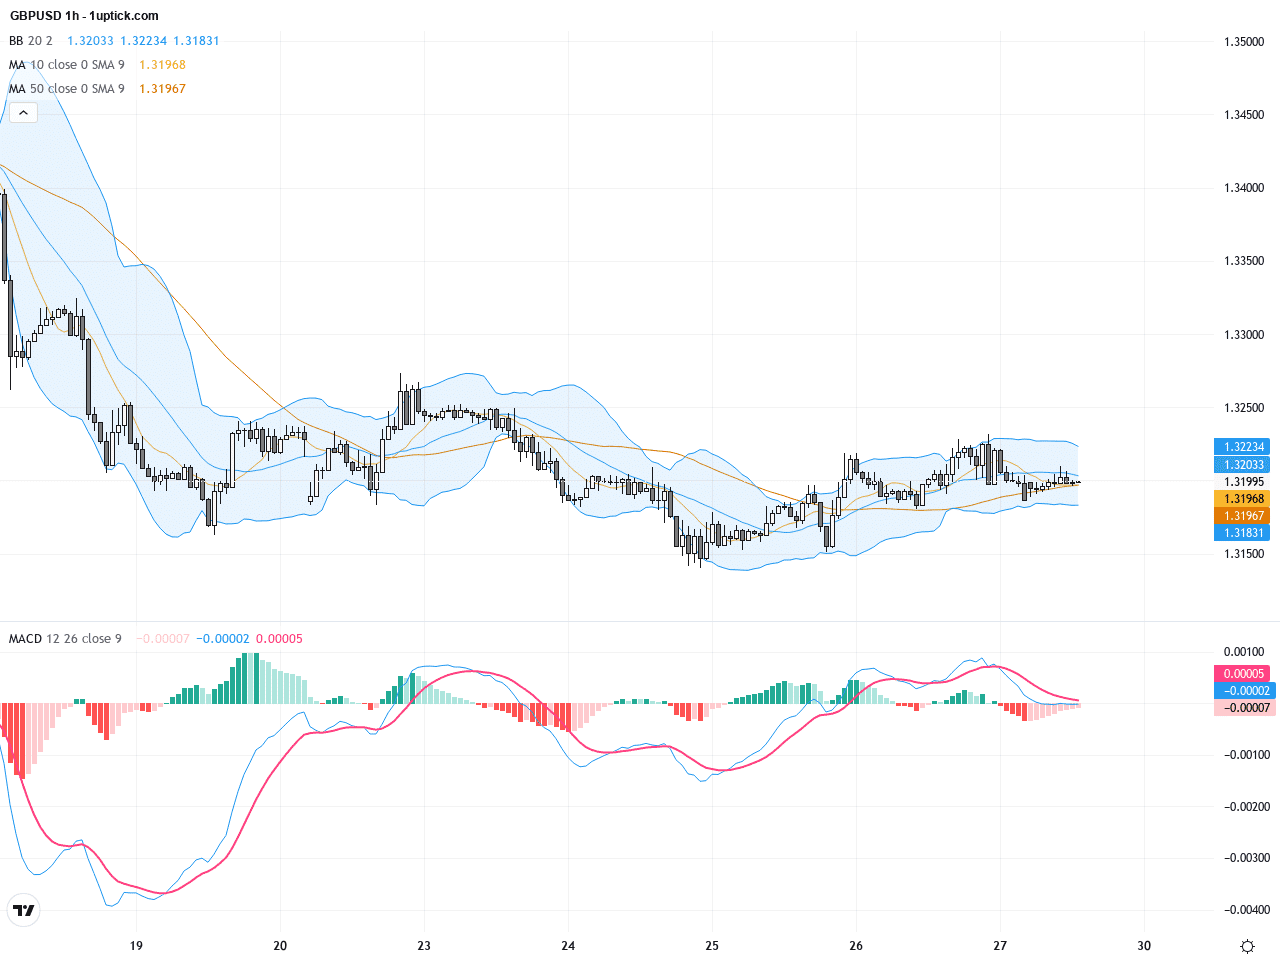
The hourly chart over the last five days shows a gradual rebound from 1.3350 lows, with the 20 EMA trending upward supporting recent price advances toward the upper Bollinger Band. A bullish engulfing candlestick pattern emerged recently, signaling renewed buying interest. With the MACD histogram shrinking its negative bars and volume picking up, a break above the 1.3450 resistance could confirm a short-term bullish reversal.
Technical Trend: Cautiously consolidating
Technically, GBPUSD is balancing between bullish and bearish pressures. The head and shoulders pattern on the daily chart warns of potential downside unless decisively broken. Recent bullish engulfing candles suggest short-term buyer strength, but upcoming US Federal Reserve rate decisions could inject volatility. Traders should watch the 20-day MA and 1.3450 resistance level closely for high-probability trade setups.Today’s economic calendar (GMT+1) highlights the UK Consumer Price Index (CPI) and Core CPI releases at 08:00, key inflation metrics that could sway GBPUSD direction. Market eyes will be on whether inflation readings remain at or above the 3% forecast, as this influences Bank of England rate hike expectations. No other major events expected to have immediate direct impact on GBPUSD today.
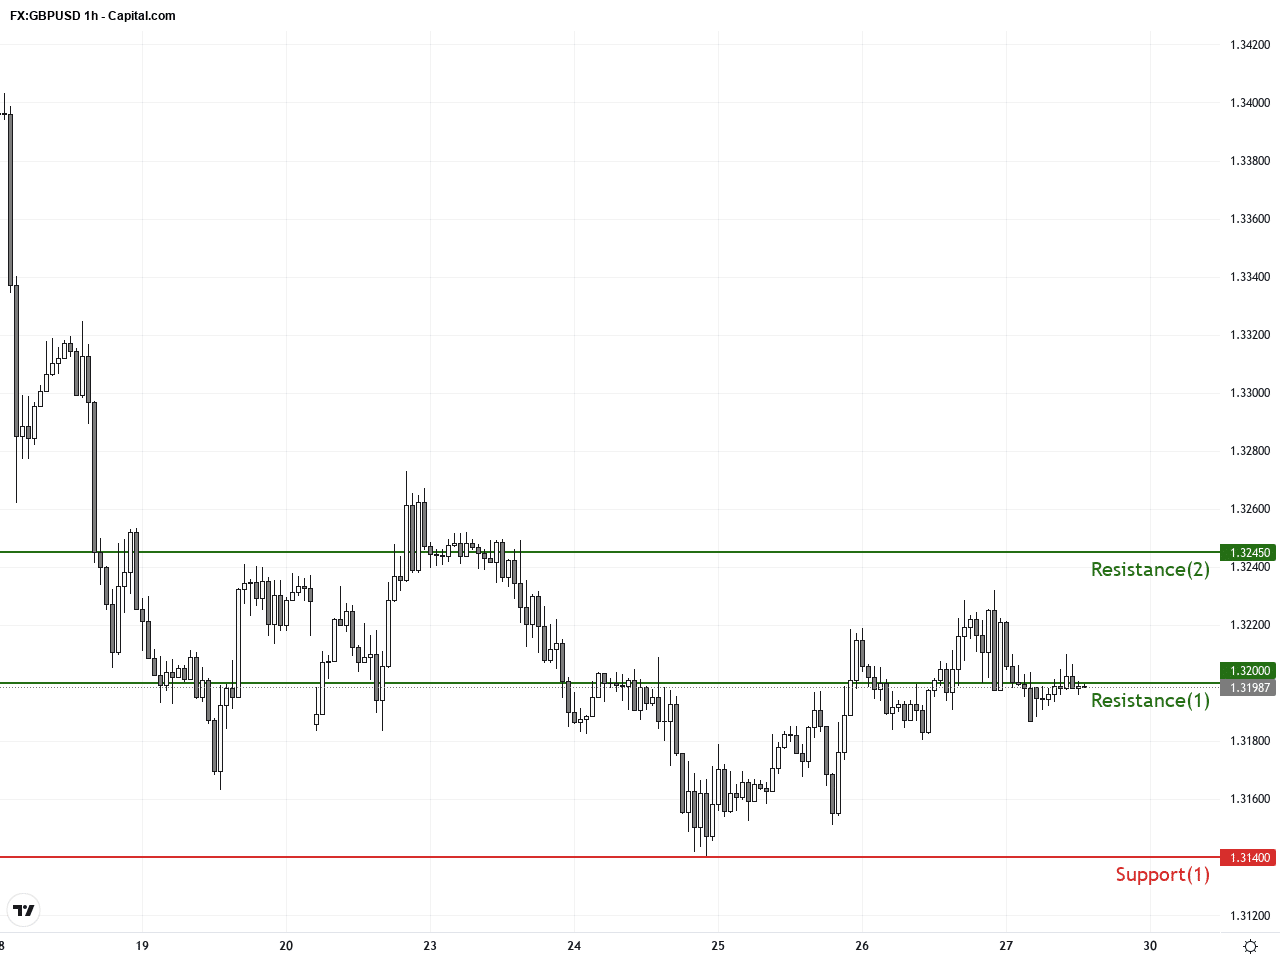
Resistance & Support
The above financial market data, quotes, charts, statistics, exchange rates, news, research, analysis, buy or sell ratings, financial education, and other information are for reference only. Before making any trades based on this information, you should consult independent professional advice to verify pricing data or obtain more detailed market information. 1uptick.com should not be regarded as soliciting any subscriber or visitor to execute any trade. You are solely responsible for all of your own trading decisions.