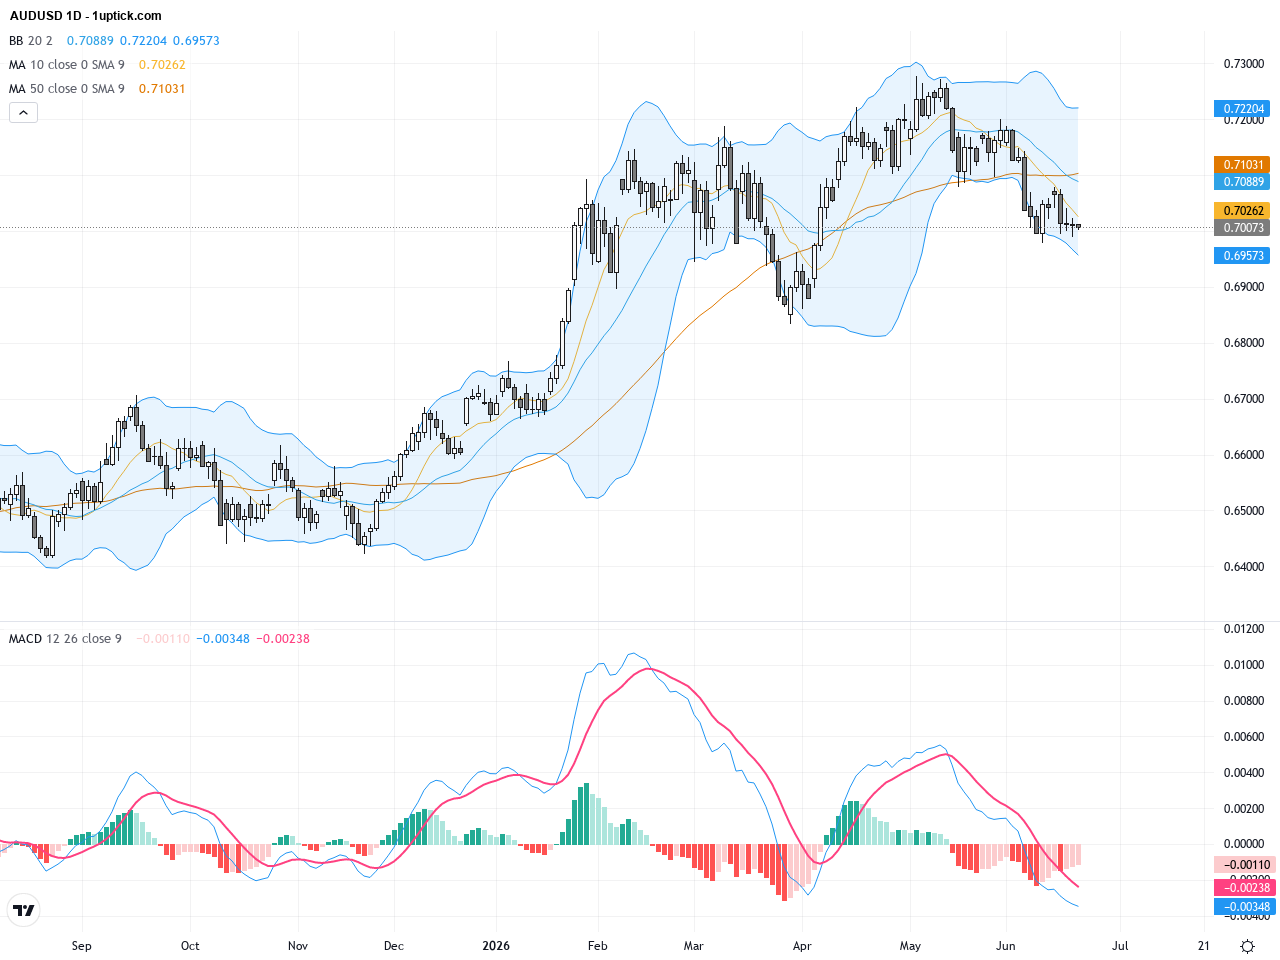
Over the past 24 to 48 hours, the Australian Dollar against the US Dollar (AUD/USD) has shown a clear downward trend. The closing price yesterday stood at 0.70073, slightly down by approximately 0.00045 points, reflecting overall market weakness for the Aussie. This dip was primarily driven by a stronger US dollar alongside robust US employment data, prompting investors to flock toward the dollar as a safe haven.
Recent market news highlights the Federal Reserve’s hawkish stance, which has pressured the Australian stock market (ASX 200) and resource stocks including gold, uranium, and lithium – factors that weigh further on the Australian dollar’s performance. Although the Reserve Bank of Australia (RBA) is expected to hold interest rates steady at 4.35% this month, the strong US dollar and the latest US Nonfarm Payrolls data have boosted the greenback’s appeal, causing intensified selling pressure on AUD in the forex markets.
For the average investor, this means the Australian dollar is facing challenges not just from stable local rate policies but predominantly from external US economic data bolstering the dollar. Investors holding AUD assets should closely monitor US economic releases and evolving global macro conditions to fine-tune their strategies and manage risks appropriately.
From the daily chart perspective, AUDUSD climbed to a peak near 0.7277 earlier this year before undergoing a retracement. Recent price movement has consolidated between the 0.69 to 0.71 range. The 50-day moving average remains above the 200-day moving average, indicating a longer-term uptrend, although the price is currently testing the 50-day MA as support. Bollinger Bands are narrowing, signaling decreased volatility, while the MACD remains positive but shows signs of weakening momentum, suggesting limited buying pressure ahead.
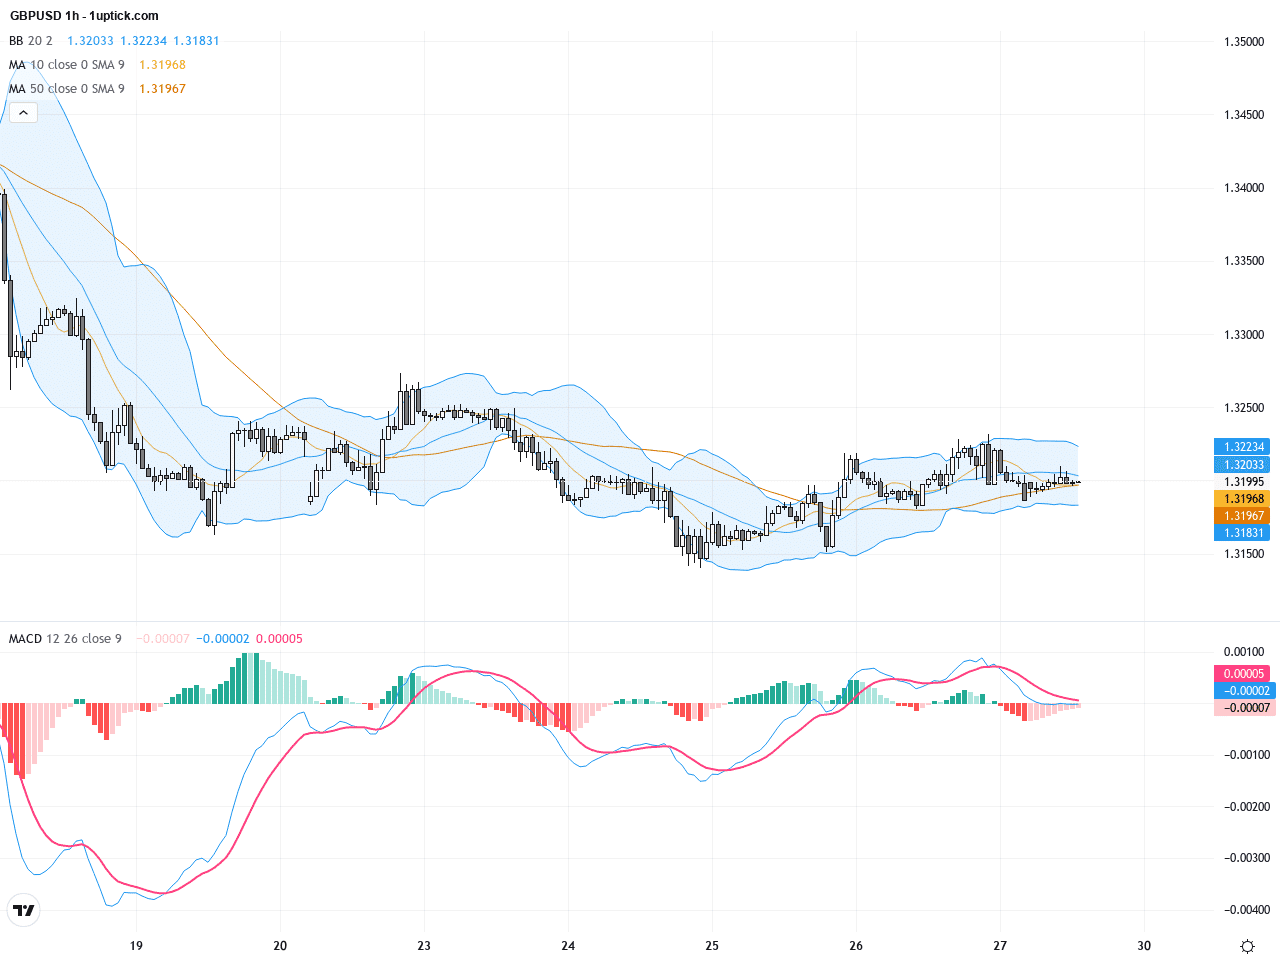
On the hourly chart, the past 3 to 5 days show a downtrend from around 0.7050. The price has broken below the Bollinger Band middle line and repeatedly tested the lower band. The MACD has formed a bearish crossover and the RSI is near oversold territory, underscoring short-term bearish momentum. Recent candlesticks display multiple small candles with long upper wicks, indicating buying exhaustion and suggesting persistent downward pressure or sideways consolidation in the near term.
Technical Trend: The short-term trend is cautiously bearish, characterized by limited declines and alternating consolidation phases. Monitoring key support levels will be essential to determine the next directional move.
Technically, AUDUSD is situated between the 50-day and 200-day moving averages, defining a critical support-resistance zone. Short-term momentum indicators like the MACD bearish crossover and near-oversold RSI signal potential for a retracement, warranting close watch for reversal signs. Candlestick analysis reveals bearish pressure with multiple recent candles featuring upper wicks, suggesting the bears hold a slight edge currently and the outlook appears cautiously bearish.There are no significant economic events directly impacting AUDUSD scheduled today. Market movements will likely continue to be driven by recent US labor data and Australian rate policy developments. Traders should stay alert for upcoming Australian inflation and employment reports for fresh directional cues.
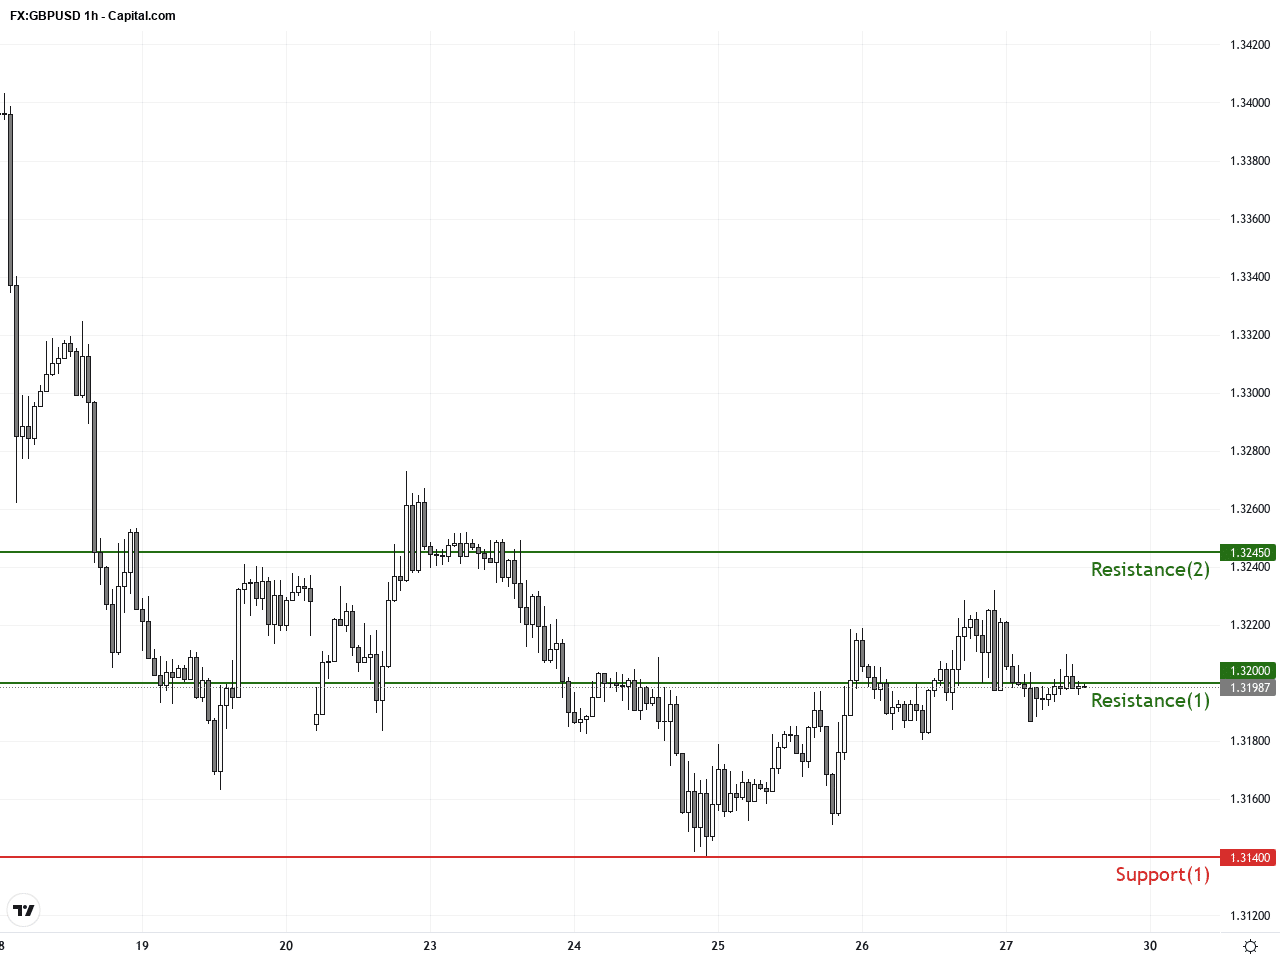
Resistance & Support
The above financial market data, quotes, charts, statistics, exchange rates, news, research, analysis, buy or sell ratings, financial education, and other information are for reference only. Before making any trades based on this information, you should consult independent professional advice to verify pricing data or obtain more detailed market information. 1uptick.com should not be regarded as soliciting any subscriber or visitor to execute any trade. You are solely responsible for all of your own trading decisions.