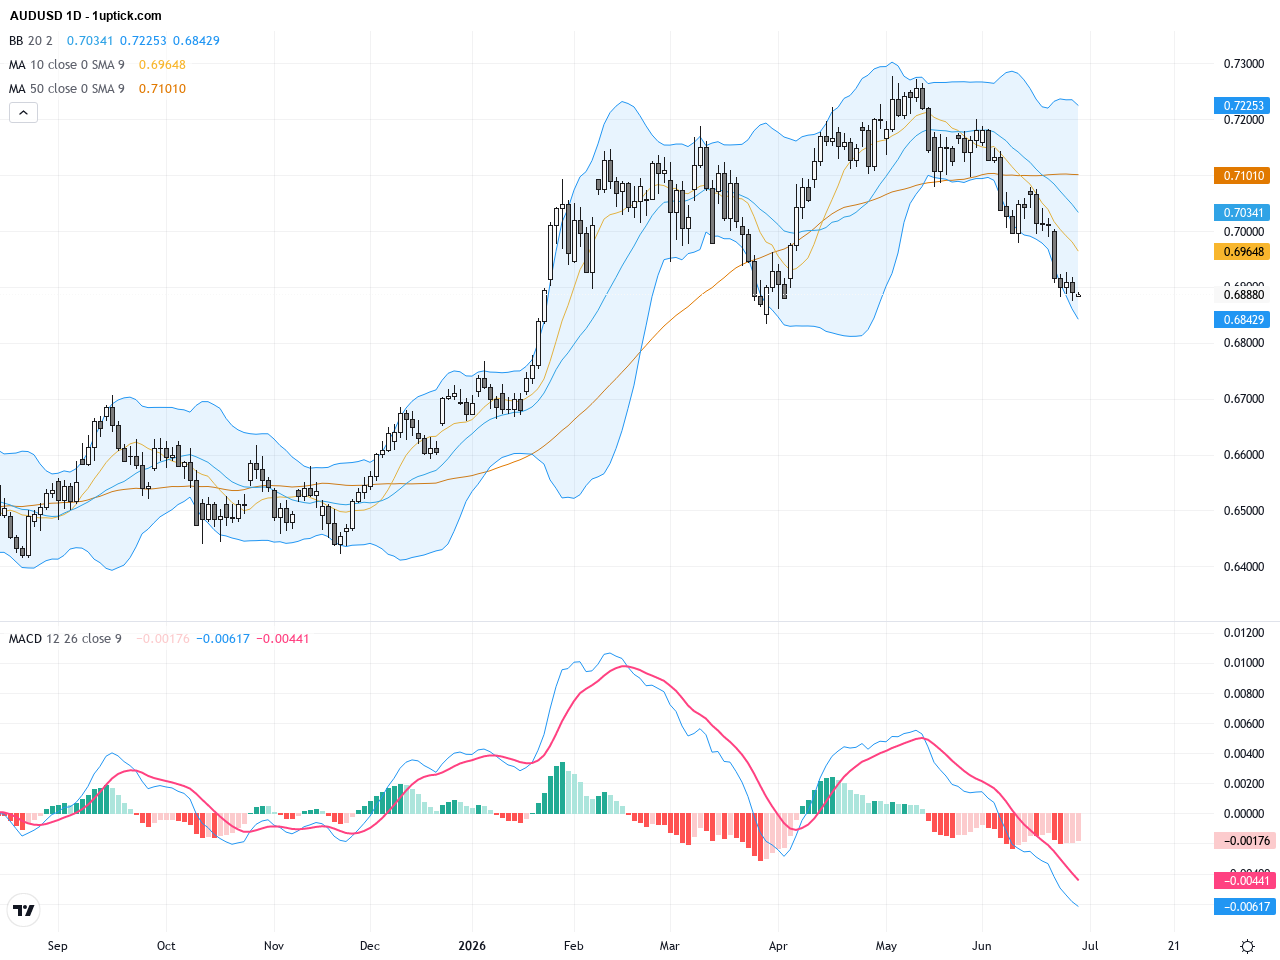
Over the past 24 to 48 hours, AUD/USD exhibited notable volatility, falling from yesterday’s close of 0.69089 to 0.68854, indicating market pressure. The immediate trigger was the release of Australia’s consumer price index (CPI) which caused AUD/USD to slide to an 11-week low of 0.6899, sparking concerns over Australia’s inflation outlook and weakening the Australian dollar.
Market updates highlighted a strengthening U.S. dollar combined with mixed Australian CPI data, creating a challenging macro environment for the AUD. Although the Australian stock market (ASX 200) saw a rebound in gold, iron ore, and energy stocks, this momentum did not translate into AUD/USD gains. Furthermore, expectations that the Reserve Bank of Australia (RBA) would hold interest rates steady curtailed the currency’s appeal, exacerbating short-term weakness in the Aussie.
For the average investor, the last 48 hours may have felt like a setback for the Australian dollar due to the softer inflation figures and a resurgent U.S. dollar. This serves as a reminder to closely watch central bank moves and inflation data going forward, as these key fundamentals will continue to shape the Australian dollar’s trajectory.
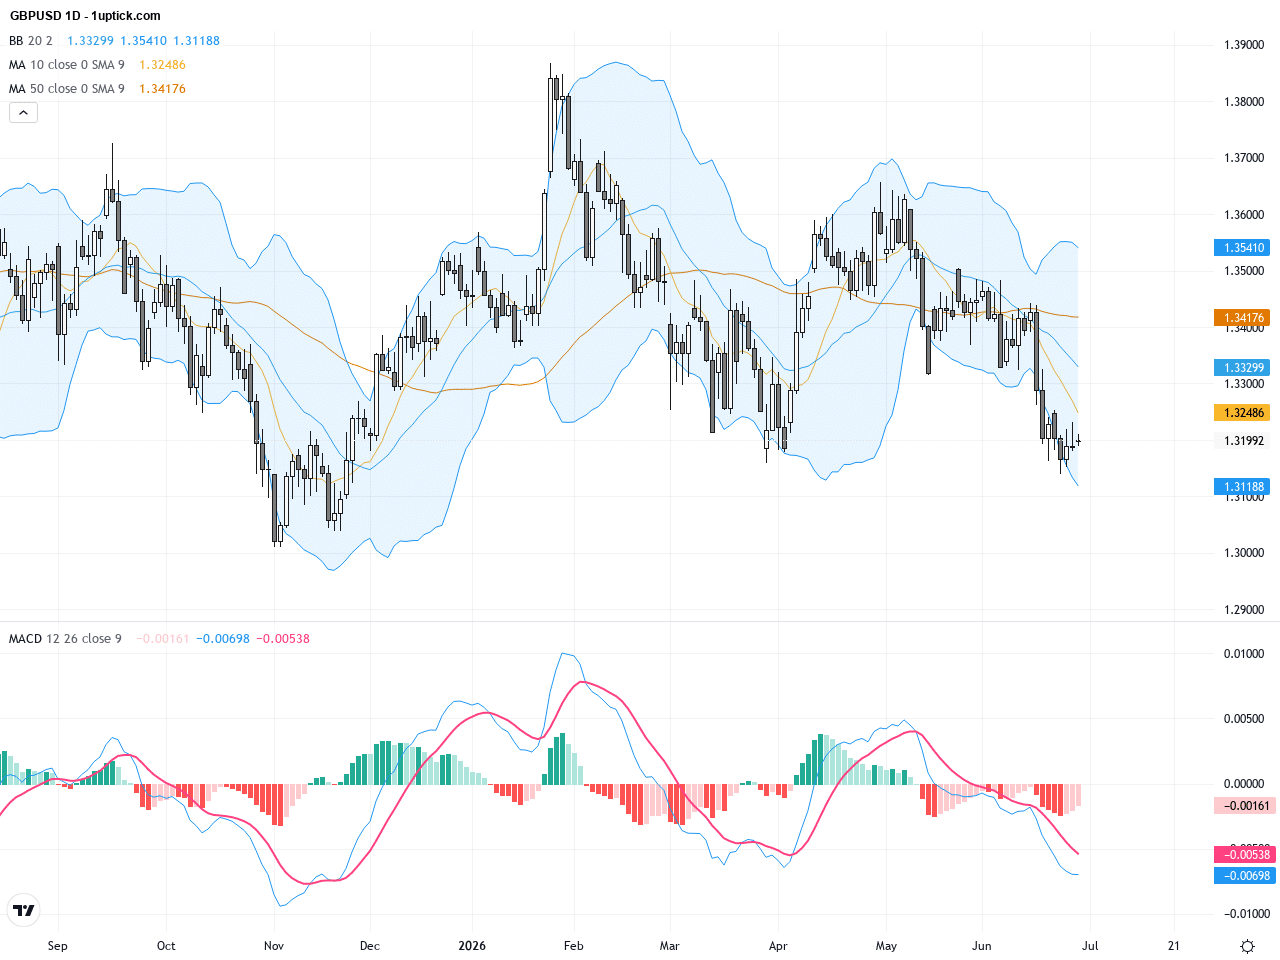
The daily chart shows AUDUSD has steadily declined from the 0.715 level, confirming a downtrend, recently breaking below the 200-day EMA near 0.6917, signaling weakening long-term bullish momentum. The Bollinger Bands are widening downward and MACD is experiencing a bearish crossover, moving away from zero, indicating bearish momentum. The price is testing support near 0.688, with no clear reversal signals yet but watch for potential hammer or long lower shadow candlesticks indicating possible short-term stabilization.
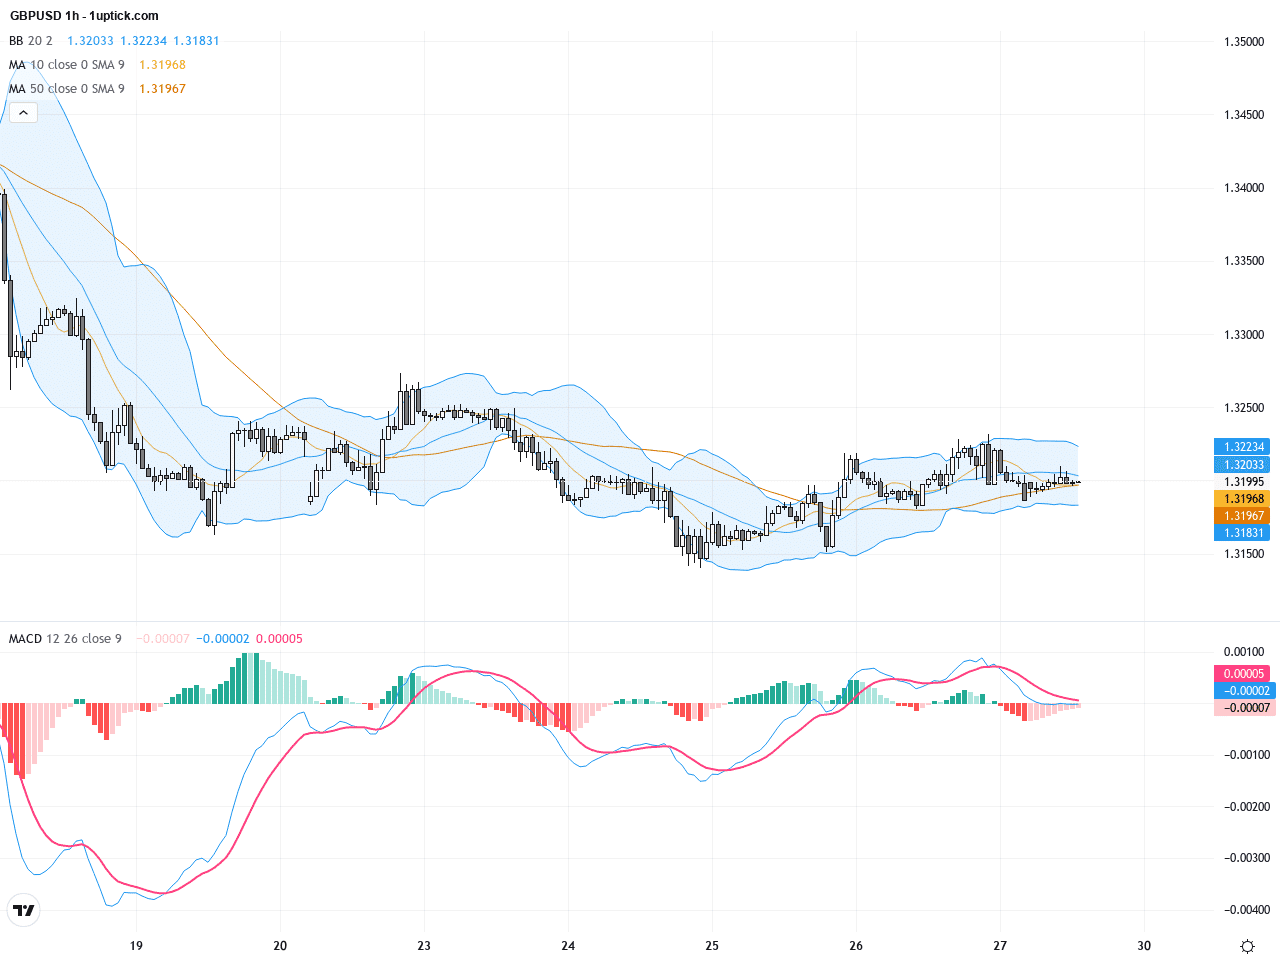
The hourly chart over the last 3-5 days depicts a steady decline forming a bearish flag pattern, suggesting continued downward pressure. The 50 and 100-period moving averages are positioned above price, acting as resistance. The MACD remains negative with expanding bearish momentum, and RSI approaches the oversold zone around 30, implying a possible short-term rebound but limited by resistance levels from mid-term moving averages.
Technical Trend: Cautiously Bearish Short Term
Technically, AUDUSD breaking below the critical 200-day EMA signals weakening long-term bullish momentum. Daily MACD bearish crossover and widening Bollinger Bands suggest sustained downside risk. The hourly chart shows near-term oversold conditions, offering scope for a technical bounce. The recent bearish flag pattern indicates sellers retain control unless price breaks above the mid-term moving averages. Observing the RBA Governor’s speech for dovish hints is crucial, as further USD strength could exacerbate AUD weakness.Today’s economic calendar highlights a speech by RBA Governor Bullock at 14:15 GMT+1 (21:15 HKT), an event likely to trigger volatility in AUDUSD as markets digest signals on policy and economic outlook. Additionally, FOMC member Barkin’s speech at 18:35 GMT+1 (01:35 HKT) may indirectly influence USD strength and thus AUDUSD movement. Overall, the RBA event is the key focal point today for traders to watch for possible price swings.
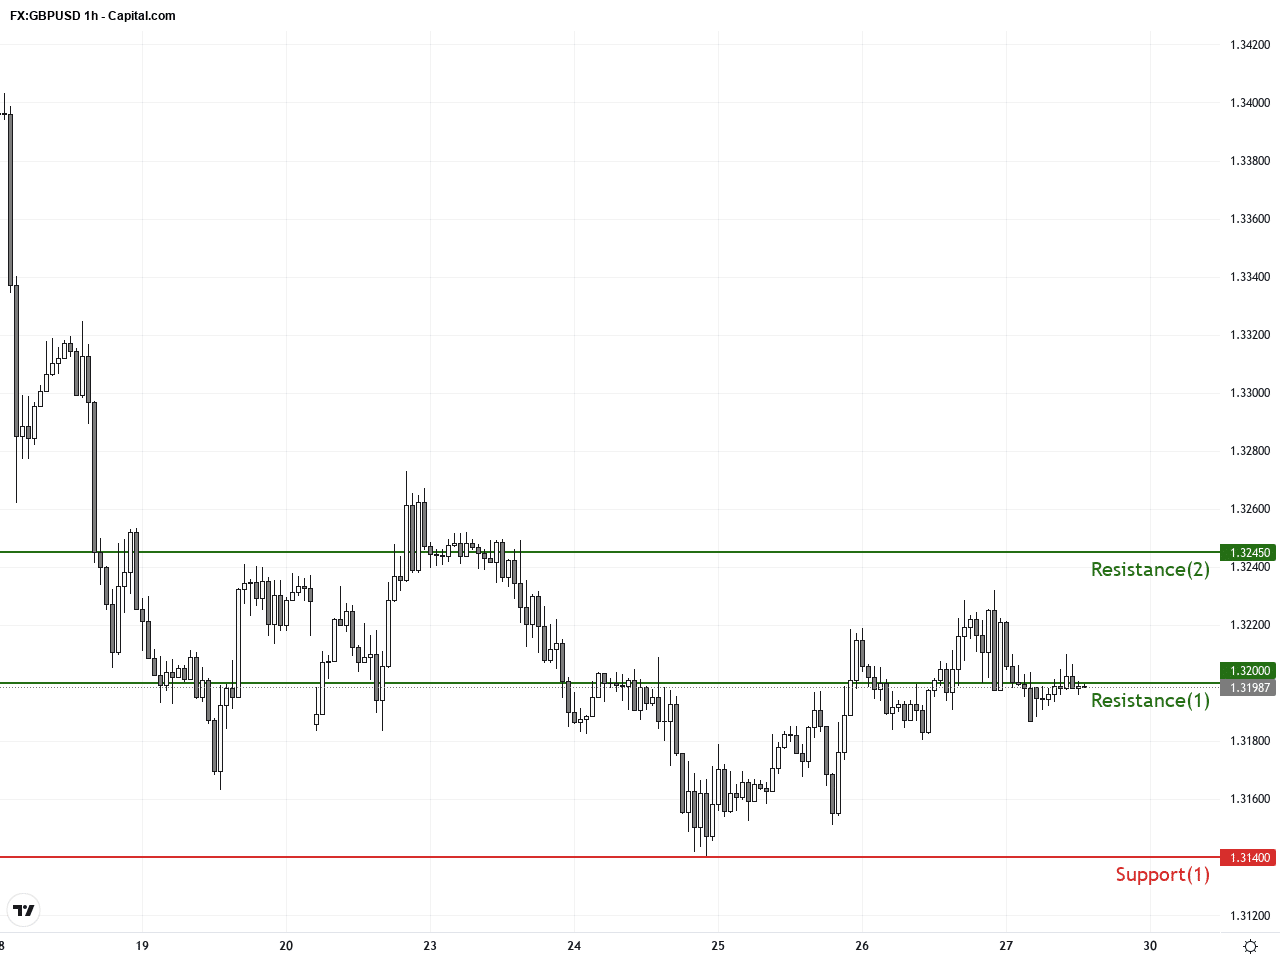
Resistance & Support
The above financial market data, quotes, charts, statistics, exchange rates, news, research, analysis, buy or sell ratings, financial education, and other information are for reference only. Before making any trades based on this information, you should consult independent professional advice to verify pricing data or obtain more detailed market information. 1uptick.com should not be regarded as soliciting any subscriber or visitor to execute any trade. You are solely responsible for all of your own trading decisions.