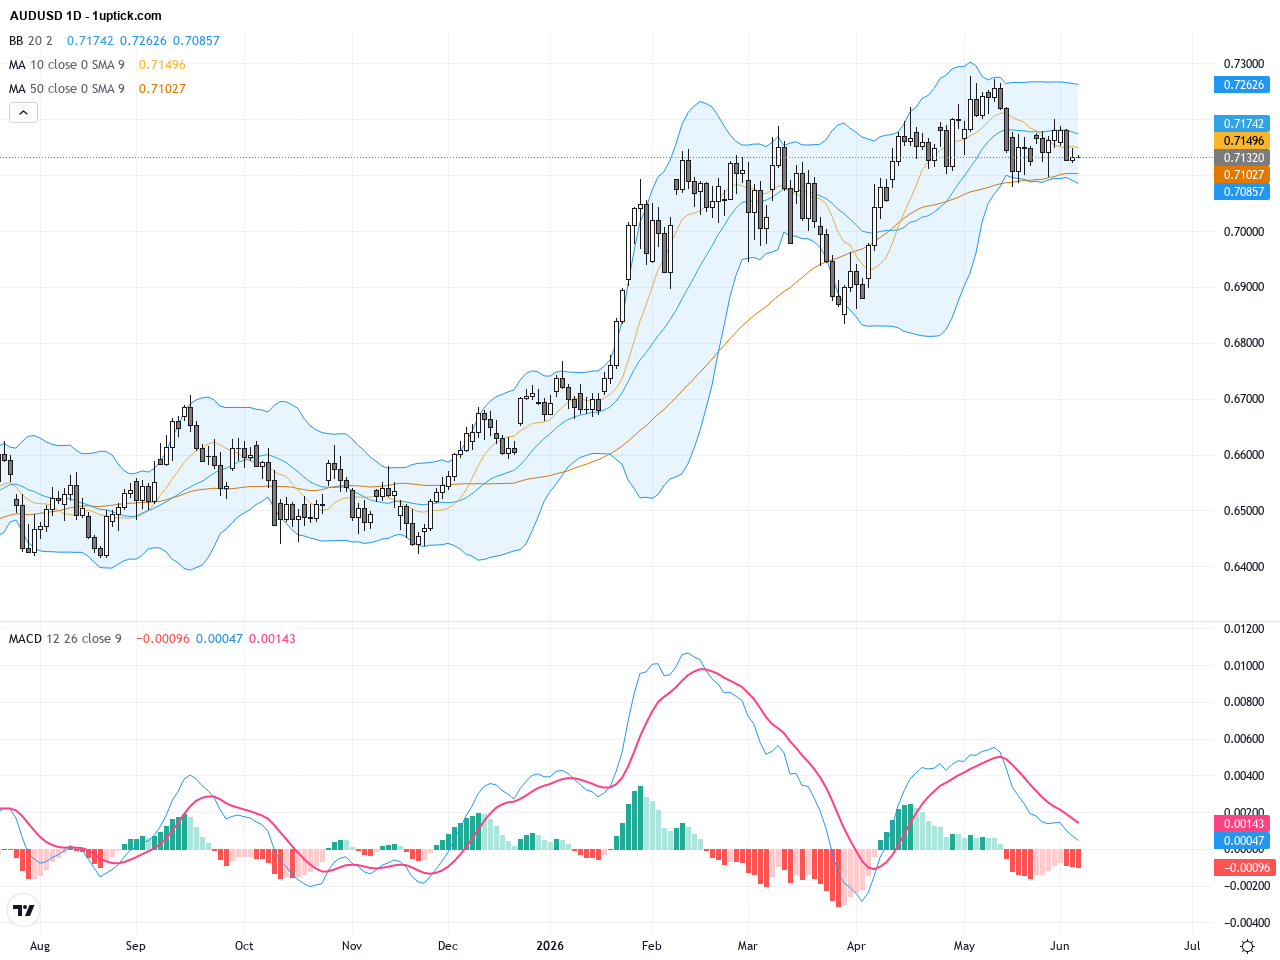
Over the past 24 to 48 hours, the AUD/USD pair has maintained a medium-term bullish trend, though momentum has somewhat cooled, closing yesterday at 0.7132. Recent Australian economic releases, including weaker-than-expected GDP and industry data, have introduced caution, applying downward pressure on the currency pair.
According to reports like “Aussies Bulls Hold 0.71015 As Weak Industry Data And GDP Miss Tests Momentum,” Australia’s softer economic fundamentals challenge the Aussie bulls. The price has been hovering near the 0.71015 support level, indicating buying interest remains, but overall growth momentum is slowing down. For investors, this means deploying capital cautiously to mitigate volatility risks from uncertain economic outlooks.
In simple terms for the average investor, while the Aussie dollar still holds mid-term upside potential, recent data serve as reminders to beware of risks. Slower Australian economic growth suggests the currency is unlikely to rapidly break new highs, reflecting the market’s anticipation for clearer economic signals.
The daily chart reveals a clear uptrend from the beginning of the year, with prices trading above both the 50-day (around 0.7157) and 200-day (around 0.6868) moving averages, indicating medium to long-term bullishness. Bollinger Bands are moderately wide, with the price near the middle band, suggesting balanced volatility. The MACD histogram is shrinking, signaling weakening upward momentum and a possible pause or consolidation phase continuing.
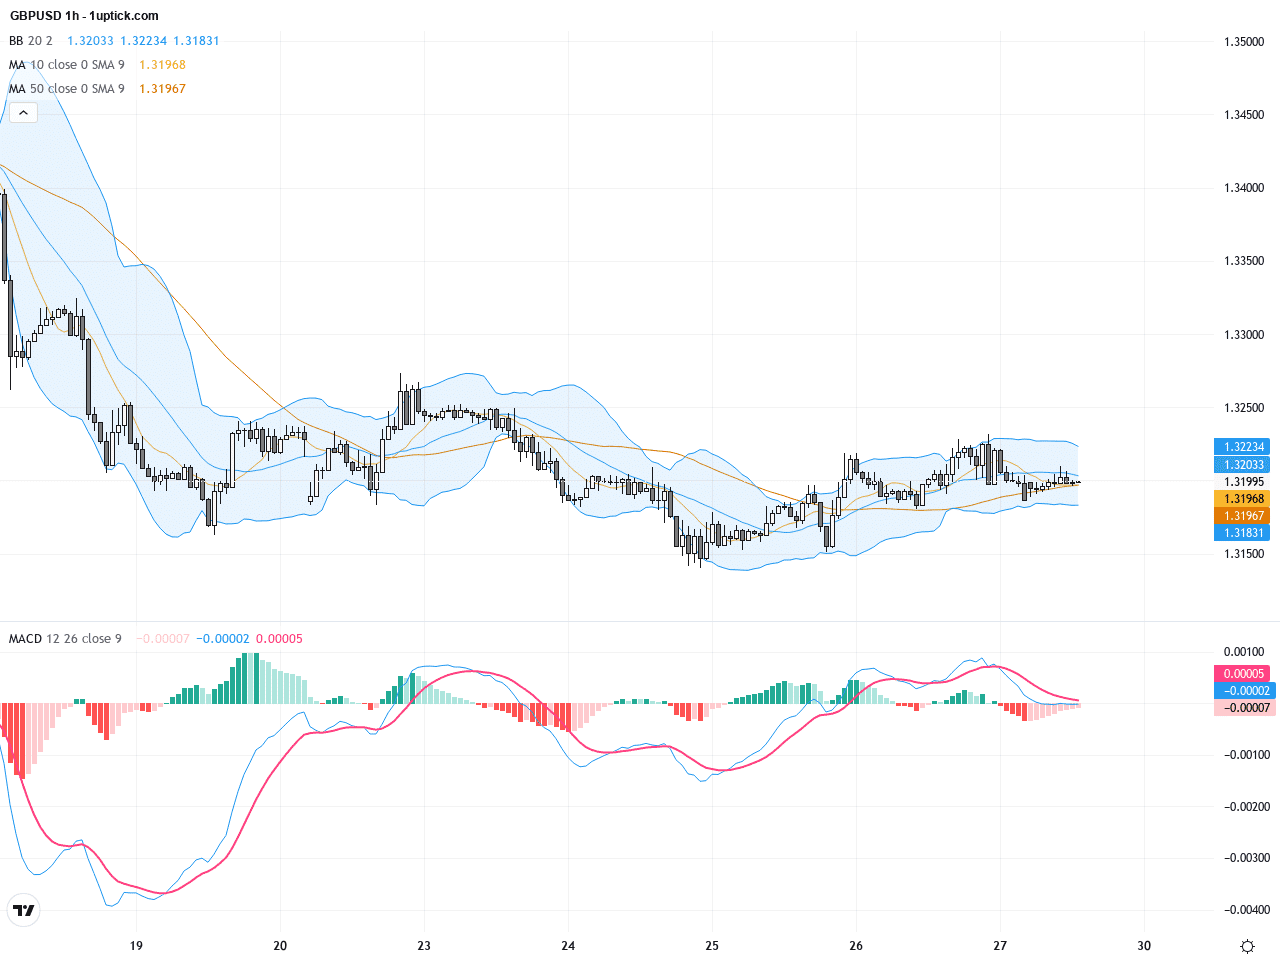
The hourly chart over the past 5 days shows AUDUSD consolidating between 0.712 and 0.715. The 20 and 50-period moving averages are entwined, reflecting short-term indecision. MACD oscillates near the zero line without clear divergence, indicating muted momentum. Notably, a hammer candlestick has formed recently, hinting at diminished selling pressure, but volume remains subdued, requiring caution before anticipating a breakout.
Technical Trend: Current trend is cautiously bullish within a resilient sideways trading range.
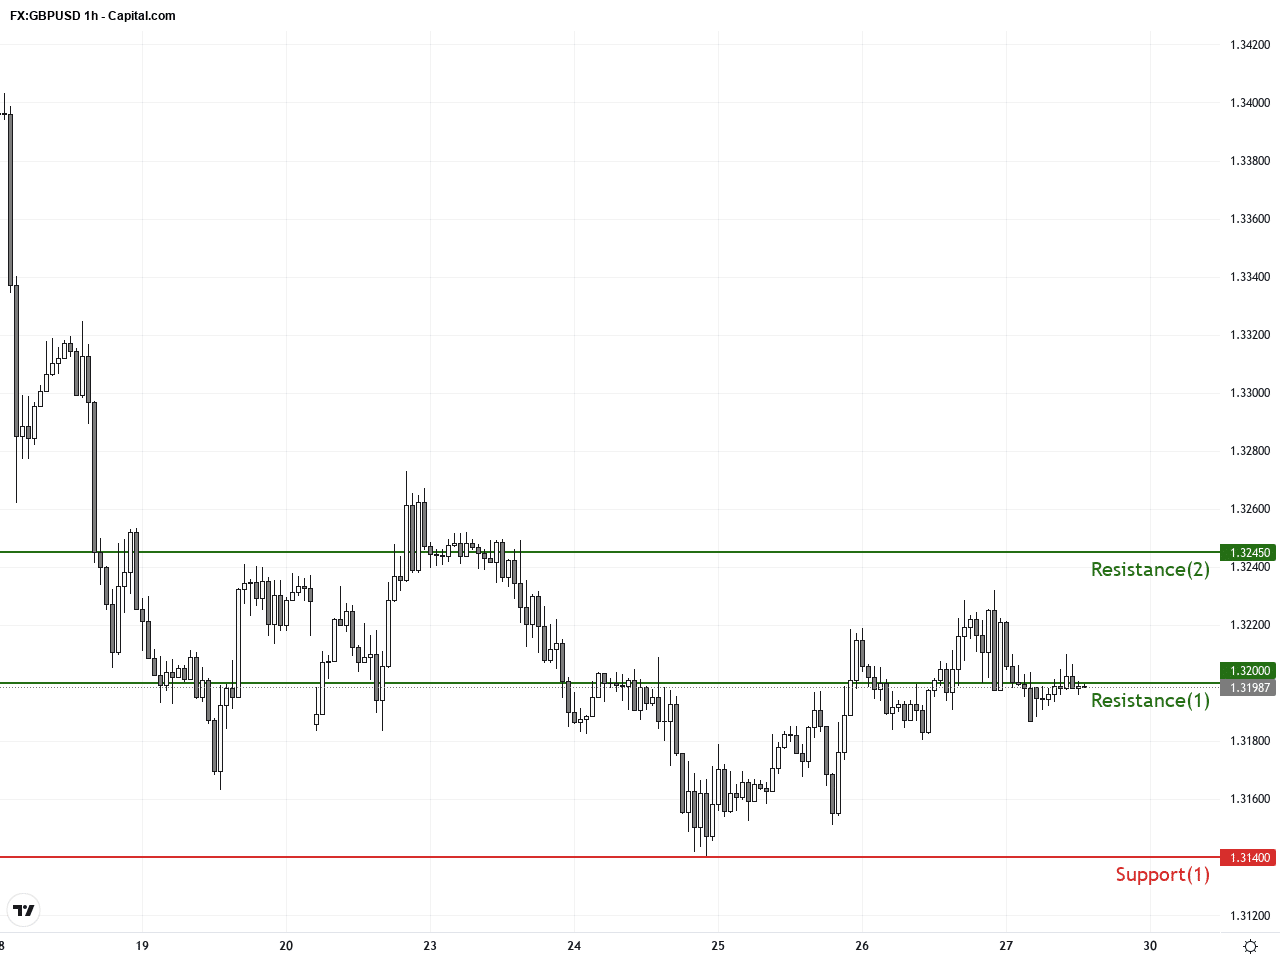
Technically, AUDUSD is positioned near critical support at 0.71015. MACD shows a slight bullish divergence, and recent hammer candles suggest weakening downside momentum. Maintaining above this level coupled with increased volume could ignite a rebound. On the upside, a break above 0.7180 would bolster bullish confidence, while a fall below 0.7100 risks a deeper correction.Today’s Australian April trade balance surprised positively at 1.79 billion AUD vs. the forecasted 1.1 billion AUD, lending support to the AUD. RBA Chairman Bullock’s speech later today could play a vital role; dovish tones may weigh on AUDUSD, while hawkish remarks could boost it. Apart from this, no major negative economic events are expected, supporting range-bound trading conditions near current levels.
Resistance & Support
The above financial market data, quotes, charts, statistics, exchange rates, news, research, analysis, buy or sell ratings, financial education, and other information are for reference only. Before making any trades based on this information, you should consult independent professional advice to verify pricing data or obtain more detailed market information. 1uptick.com should not be regarded as soliciting any subscriber or visitor to execute any trade. You are solely responsible for all of your own trading decisions.